Augmented reality, a computer trick to place the virtual within the real world,…
-
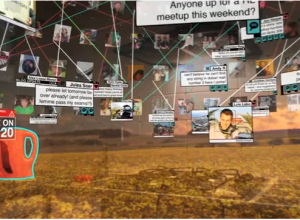
Augmented reality taken to the extreme
-
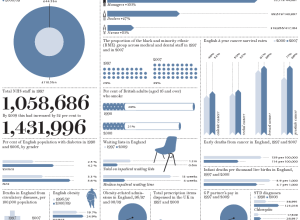
How Britain has changed since 1997
Prospect Magazine takes a look at how Britain has changed by the numbers…
-
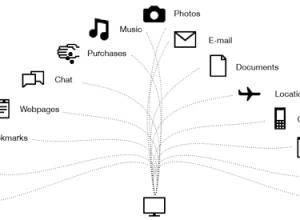
Poyozo the personal data gatherer
Take a moment and think off all the data you put other there…
-
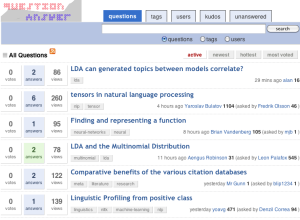
Stack Overflow for data geeks
I can’t count how many times I’ve googled a programming-related question and found…
-
JavaScript InfoVis Toolkit 2.0 released
Visualization in JavaScript is all the rage these days. Just a couple of…
-
Open data doesn’t empower communities
internet.artizans reflects on the usefulness of open data:
I’m inspired by the idea… -
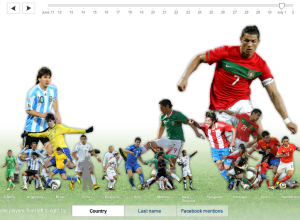
Top World Cup players on Facebook
I always know when something exciting happens in the World Cup when my…
-
Running on Thesis Fumes
I’m in the fifth year of my statistics PhD, and the time has…
-

Geography of Lost island
GIS guy Jonah Adkins maps the geography of Lost (the tv series). It…
-

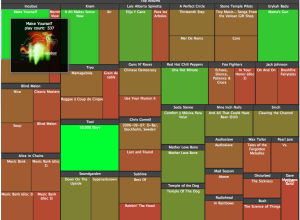
Challenge: What is a FIFA player’s worth?
I really want to like this graphic on the “worth” of FIFA players.…
-

Mapping what your neighborhood used to look like
In part of their initiative to get young and old people to hang…
-
FlowingData is brought to you by…
My many thanks to the FlowingData sponsors who help keep the gears turning…
-
Who participates online, by age
Arno Ghelfi for Businessweek reports on who’s doing what online, separated by age.…
-

Modern history of human communication
With the announcement of Google Voice for everyone, the big G describes the…
-

Facts and figures of London life
Field Design takes a look at a day in London:
LDN24 is a… -
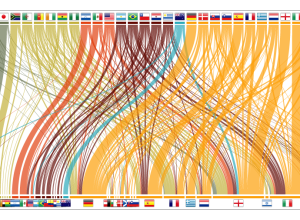
Imported World Cup players
The World Cup is an event where countries from all over the world…
-
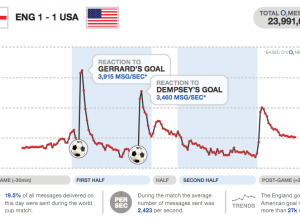
Texting volume during World Cup matches
I love how major sporting events can captivate an entire country or region,…
-

Education crisis explained in motion graphics
Buck, in collaboration with TakePart and An Inconvenient Truth director, Davis Guggenheim, describe…
-
Do Movie Sequels Live Up to Their Originals?
The third installment of Pixar’s Toy Story is making a killing at the…
-
Happy birthday, FlowingData. You’re three today
Can you believe it? FlowingData is three years old today. I’m in the…
Recently for Members
Second Edition
 Visualize This: The FlowingData Guide to Design, Visualization, and Statistics (2nd Edition)
 Visualize This: The FlowingData Guide to Design, Visualization, and Statistics (2nd Edition)
New tools, refined process.
Browse by Chart Type See All →


