Andrew Garcia Phillips and Stephen Grocer of The Wall Street Journal compare the…
-
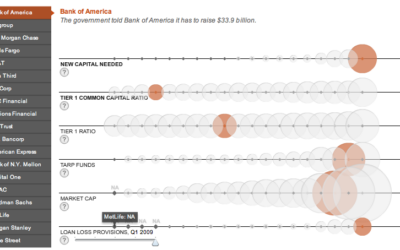
Bubbles Galore in Analysis of Banks’ Financial Health
-
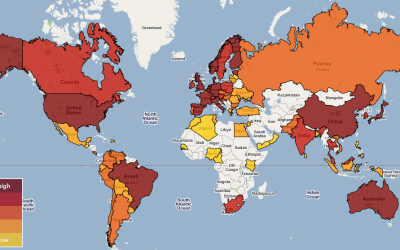
Maps of the Seven Deadly Sins
Geographers from Kansas State University map the spatial distribution of the seven deadly…
-
50 Cars to Make One Bus?
Flygbussarna, a Swedish coach bus company, in partnership with the Acne marketing group,…
-
Interaction Design Pilot Year Churns Out Great Student Projects
In a collaborative initiative between Copenhagen Institute of Interaction Design and The Danish…
-
POLL: What Data-related Area Are You Most Interested In?
It’s time for a FlowingData poll. I want to know what data-ish things…
-

37 Data-ish Blogs You Should Know About
You might not know it, but there are actually a ton of data…
-
Here & There: Horizonless Perspective of Manhattan
Jack Schulze provides this horizonless view of Manhattan:
Here & There is a… -
10 Visualizations for Number of Days to Pay Your Taxes
A couple weeks ago, FlowingData ran another Visualize This challenge. I posted a…
-
Spectrum of Online Friendship
This graphic, from Mike Arauz, describes different levels of online friendship, starting at…
-
What Drugs Pose the Greatest Danger?
While The New York Times continues to produce excellent work, GOOD Magazine has…
-
Is Your Country Involved in Open Source?
Red Hat, an open source leader best known for their Linux distribution, maps…
-
Google Adds Search to Public Data
Google announced today that they have made a small subset of public datasets…
-
Tracking Swine Flu Worldwide – Where and How, Plus Data
Just about everywhere you go there’s something in the news about swine flu,…
-
Visualizing the United States Power Grid
NPR provides an in depth view of the U.S. electric grid, exploring the…
-
Turning Statistics Into Knowledge – 3 Days Left to Sign Up
The US Census Bureau, World Bank, and OECD have organized a seminar to…
-
A Couple New Looks for Google News
The ever popular newsmap (above), a tree map view of Google News, got…
-
Twitter’s Creative Director on Why He Left Google
I’m thankful for the opportunity I had to work at Google. I learned…
-
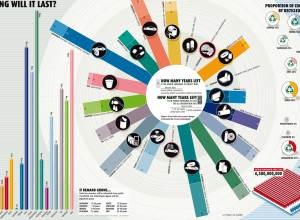
How Long Will the World’s Natural Resources Last?
This graphic from New Scientist shows when certain natural resources will run out…
-
What If We Were a World of Doers?
What exactly is a doer? Feeling much like a segment on Sesame Street,…
-
Visual Guides to the World of Street Vendors
There are over 10,000 street vendors in New York City. But how much…
Recently for Members
Second Edition
 Visualize This: The FlowingData Guide to Design, Visualization, and Statistics (2nd Edition)
 Visualize This: The FlowingData Guide to Design, Visualization, and Statistics (2nd Edition)
New tools, refined process.
Browse by Chart Type See All →


