It’s been a little over six months since I put up my first…
-
Top 10 FlowingData Posts for 2007
-
Sit Back and Relax with Casual Information Visualization
Zachary Pousman et al. write in their paper Casual Information Visualization: Depictions of…
-

Using Data to Find Likely Crime Spots
Fighting crime with statistics isn’t just for television. Now coming to a real life near you.
-
Ho, ho, ho, Meeerrrrry Christmas!
Merry Christmas Bedford Falls! Merry Christmas you old Savings and Loan! Merry Christmas…
-
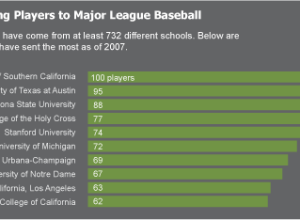
Download Detailed Baseball Statistics from the DataBank
Get your free, detailed baseball statistics here, free of charge. Go ahead, have some fun.
-

Names Mentioned in Debates by Major Presidential Candidates
As usual, The New York Times graphics department churns out another useful graphic. This time it’s in network diagram form.
-

Man Takes a Picture of Himself Every Day for 6 Years
Noah Kalina took a picture of himself every day for six years (and…
-
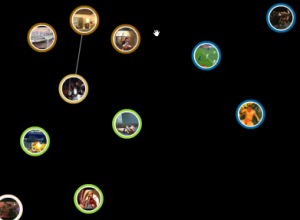
YouTube Releases Visualization for Related Videos
YouTube (or should I say Google), released their visualization for related videos. It’s…
-
One Day in the Life of the Average American
Time Magazine’s multimedia section has a fun, little piece showing some statistics for…
-
Migration/Demographics Database Available for Download
For our humanflows visualization, we used data from the United Nations Common Database…
-
Many Eyes Has Embeddable Visualization
You used to only be able to get a small thumbnail to “share”…
-
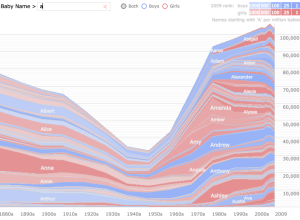
Does Your Name Affect How You Perform in Life?
Studies on names and performance seem to be all the rage right now:…
-

Netflix Prize Dataset Visualization
One million dollars goes to whoever can understand the Netflix ratings dataset best.
-
Visualizar Showcase Officially Opened at Medialab
The Visualizar Showcase is officially open and ready for public viewing, so if…
-
Google Has a Charting API Too Now
Yahoo: Look Google, I’ve got a Flash charts API now. I make it…
-
Yahoo Charts Control Library Now Available
Yahoo User Interface 2.4.0 was recently released which includes the new YUI Charts…
-
Human Flows Protoype is Online Now
I made a few tweaks and our humanflows visualization prototypes are now online.…
-
Transcript Analyzer for Republican Debate
The New York Times recently put up a cool data exploration tool to…
-

Three Designers, a Statistician, and Migration Inflows Data
After two weeks at Visualizar, I’m back in the United States. It’s good…
-
A Few More Days Left at Visualizar
I feel like it’s been forever since my last post, so I just…
Recently for Members
Second Edition
 Visualize This: The FlowingData Guide to Design, Visualization, and Statistics (2nd Edition)
 Visualize This: The FlowingData Guide to Design, Visualization, and Statistics (2nd Edition)
New tools, refined process.
Browse by Chart Type See All →


