I’m staying in a hostel here in Madrid and am currently in the…
-
Sharing Personal Data to Push Social Data Analysis
-
My First Couple of Days in Madrid
It’s been a couple of days here in Madrid. It’s about 6:00am in…
-
San Francisco Police Department Incident Reporting and Analysis Tool
I came across the San Francisco Police Department Incident and Reporting Tool, and…
-
Fast Food Restaurant Menu Items Compared
We all know fast food is incredibly bad for us and yet we…
-
News Flowing Through Moveable Type at The New York Times Building
Every day during the summer I walked past “Moveable Type” in The New…
-
Many Eyes Now Has Better Mapping Visualization
Many Eyes now has more detailed mapping functionality with the help of ESRI…
-
Headed to Spain for the Visualizar Workshop
When people I know can’t decide whether or not go to graduate school,…
-

Graphwise: Crawling the Web for Tabulated Data
Graphwise launched a few weeks ago, but I’m just hearing about it now,…
-
100 Reasons You Should Be Interested in, Want to Share, and Get Excited About Data
When I talk about data, people often zone out or don’t really see…
-
US Demographics Visualizer Using Virtual Earth
While on the topic of maps here’s a Microsoft Virtual Earth mashup —…
-
Leland Wilkinson on Bloatware
I have not yet achieved that elusive zero-byte graphics program, but I do…
-
Business of Death Video from GOOD Magazine
GOOD Magazine is really growing on me. Have you subscribed yet? All of…
-
Join Eco-Viz Challenges to Raise Environmental Awareness
Eyebeam, an art and technology research center, has posted two eco-viz challenges to…
-

Watch the Money Clock to See What You’ve Earned
Despite being surrounded with ads, this money clock was kind of, um, interesting.…
-
Use Flare Visualization Toolkit to Build Interactive Viz for the Web
Tom from Stamen Design and Hadley from the GGobi group kindly pointed me…
-
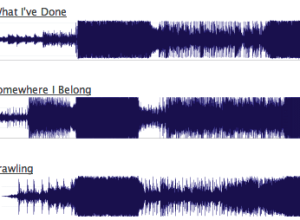
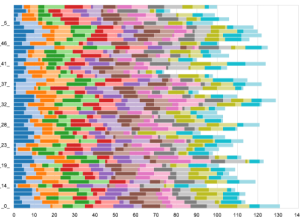
All Linkin Park Songs Look the Same? Maybe Not.
On Last.fm, someone took snapshots of some Linkin Park songs, compared them, and…
-
Competitive Edge Explorer to Display Demographics
The Competitive Edge Explorer is a mapping project from the MIT Laboratory for…
-
Create, Share, and Embed Custom Timelines with circaVie
Part of the AIM network, it’s another online application to create and share…
-
Access Restrictions on the Release of Gun Sales Data
I just found this in my draft folder from a while back. It’s…
-
World Visualization Day (Really)
I thought Robert was just thinking out loud when he wrote his post…
Recently for Members
Second Edition
 Visualize This: The FlowingData Guide to Design, Visualization, and Statistics (2nd Edition)
 Visualize This: The FlowingData Guide to Design, Visualization, and Statistics (2nd Edition)
New tools, refined process.
Browse by Chart Type See All →


