Are bubble charts effective? This seems to be a recurring question. Some say…
-
Bars as an Alternative to Bubble Charts
-
What is the Best Way to Learn Flash & Actionscript for Visualization?
Maybe someone can help me with this. I’m shifting focus from static graphics…
-
A Magazine Dedicated Entirely to Visualizing Something Useful
GOOD Magazine is “media for people who give a damn.”
While so much… -
How Do You Visualize Time in a Drawing?
Icastic has a fun (and growing) collection of (currently) 247 hand-drawings from contributors…
-
Lisa Jevbratt on the Sublime in Data Visualization
We look up at the starry sky and we sense a fear of…
-
Cover Manhattan and Then Some With All the World’s Walmarts
Speaking of Walmart, if we took all of the Walmarts in the world…
-
New Journal: Technology Innovations in Statistics Education
Technology Innovations in Statistics Education (TISE) is a new e-journal that was just…
-
Education Statistics Free, Available, and Waiting for You
Raw, fine-grain data is still a bit hard to come by. Summary statistics…
-
Social Data Analysis Workshop
I stumbled across the Social Data Analysis workshop, happening as part of CHI…
-
Presidential Nomination Polls With Smoothers
It almost feels like I see a new poll every day for who’s…
-
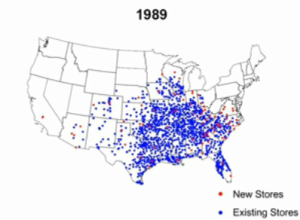
Walmart Spreads Like a Virus
Watch Walmart quickly expand like a deadly virus from the movie Outbreak. It’s…
-
Sifting Through My Mobile Phone Logs
When I was in NYC and my wife was in Buffalo, New York…
-
Gazing Deeply Into Your Many Eyes
Dear Many Eyes,
From the moment I stared into your thousands of solid… -
World Freedom Atlas
World Freedom Atlas is an online geo-visualization tool that shows a number of…
-
Is My Interest in Data Obsessive?
I just saw Stranger than Fiction. The main character, Harold Crick, spends much…
-
ProBlogger Birthday Bash Giveaway
If you have a blog, I’m sure you’ve heard of the the ever…
-

Swivel Gets a Data Guy
What the heck’s a data guy? According to Gerard, who studied computer science…
-
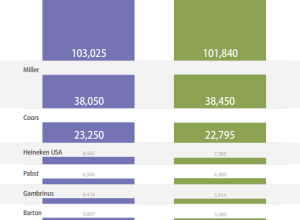
Americans Prefer Watered Down Beer
Anheuser-Busch (Budweiser), Miller, and Coors lead the way in beer. Albeit, this is…
-
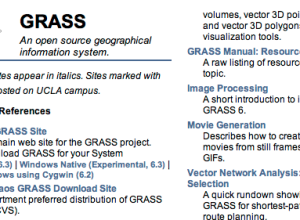
Useful Stat Resources for R and GRASS
UCLA Statistics has a pretty extensive list of resources on how to use…
-
StatGrad Discussion Board Now Open
The StatGrad discussion board is now online — a place where stat students…
Recently for Members
Second Edition
 Visualize This: The FlowingData Guide to Design, Visualization, and Statistics (2nd Edition)
 Visualize This: The FlowingData Guide to Design, Visualization, and Statistics (2nd Edition)
New tools, refined process.
Browse by Chart Type See All →


