Weight loss is a difficult task for many, further complicated with so many…
-
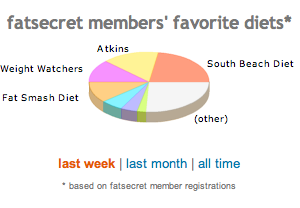
Diet and Weight Loss Tracking with Viz
-
CitiStat: Injured on Duty “Data”
I was flipping through the channels the other night and came across a…
-
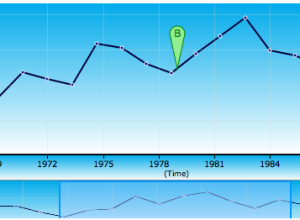
Time Series Tool Like Google Finance
Chronoscope is a work-in-progress time series visualization tool that lets you explore data…
-
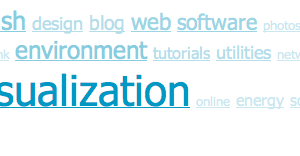
Focus Cloud: Tag Cloud with a Twist
Everyone’s familiar with tag clouds, but Aaron Bassett put a slight twist to…
-
Same Big Mac Data, Different Platform
I went to Swivel, to see how they did with the same Big…
-
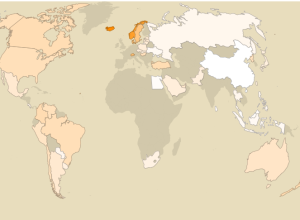
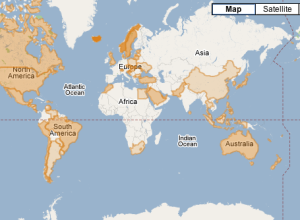
Cost of Big Macs Worldwide
I was playing around at Many Eyes, and it was amazingly easy to…
-
Motivation to Change Behavior
My mom recently, um, as in yesterday, got in a car accident. She…
-
Macromedia Flash: First Impressions
Flash or Processing? For now, Flash.
For quite a while now, I’ve been…
-
Increasing Energy Awareness Through Design
The folks with STATIC!, a project led by the Interactive Institute in Switzerland,…
-
Creating Effective Visualization
What makes a visualization good? It allows people to see what they never…
Recently for Members
Second Edition
 Visualize This: The FlowingData Guide to Design, Visualization, and Statistics (2nd Edition)
 Visualize This: The FlowingData Guide to Design, Visualization, and Statistics (2nd Edition)
New tools, refined process.
Browse by Chart Type See All →


