This venn diagram showing results from tests for Autism really seems to be…
-
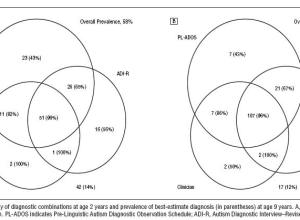
Find a Replacement for this Ugly Venn Diagram
-
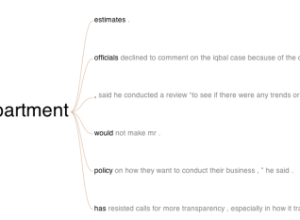
Using Many Eyes to Visualize Text
Some time last month, Many Eyes introduced their text visualization, the word tree.…
-
New York Mets Not Looking So Good
I’ve never really been interested in baseball. I’ve always been more of a…
-
Misleading Map of Buffalo Snow
I saw this map of the average snow levels in Buffalo. I think…
-
Use Mint to Manage Your Finances
Mint was released last week. It’s an online application that brings financial data…
-

My Last Graphic at The Times
Friday was my last day at The Times, and this past Sunday, my…
-

Visualization of US Flight Patterns
When I think airplanes and data visualization, I think of Aaron Koblin’s Flight…
-
John Maeda Speaks About Simplicity
John Maeda, a professor in the MIT Media Lab, gives his talk on…
-
My Last Day as a New York Times Graphics Editor Intern
Today is my last day at The New York Times. Ten weeks and…
-
Overgeneralizing on Chinese Takeout
My roommate pointed out a couple of weeks ago that I always get…
-
Data Collection With USB Pedometer. Weight No More!
I’m thinking it might be time to revive my step count data collection…
-
West Coast Stata Users Group, Oct. 25
For those interested in or who already use Stata, the first Stata users…
-
A Repetitive Hate for Statistics
When I tell people that I’m a graduate student in Statistics, there are…
-
Deaths While Crossing the Border
With a stricter border patrol, more Mexican illegal immigrants are taking dangerous routes…
-
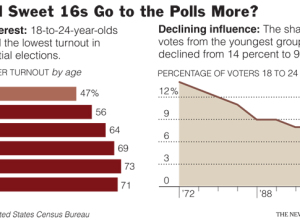
Presidential Election Voting by the Young People of America
I actually did this graphic some time last month for the Week in…
-

Published Data and Results Not Always Legit
In a previous life, I thought anything published in an academic journal was…
-

Wise Words from John Tukey
The greatest value of a picture is when it forces us to notice…
-
My Love-hate Relationship with ArcGIS
ArcGIS can do a lot for you in terms of speeding up the…
-

John Snow’s Famous Cholera Map
If you’ve read any books on visualization, without a doubt, you’ve seen John…
-

Displaying Data as Efficiently as Possible
The above picture isn’t totally related, but I just had to put it…
Recently for Members
Second Edition
 Visualize This: The FlowingData Guide to Design, Visualization, and Statistics (2nd Edition)
 Visualize This: The FlowingData Guide to Design, Visualization, and Statistics (2nd Edition)
New tools, refined process.
Browse by Chart Type See All →


