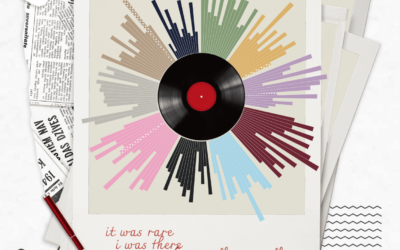
For The Pudding, Russell Samora pulled songs via the Spotify API and made…
Infographics
Telling stories with data and graphics.
-

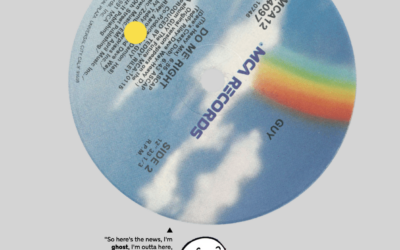
Clock plays a song with the current time in its title
-

Infinity abstractions
Infinity is an abstraction of endlessness, which seems to suggest that it cannot…
-

Explorable explanation for matrix transformations
Instead of using a bunch of equations to memorize, Yi Zhe Ang visually…
-

Using cold lake water to cool buildings
There are buildings in Toronto, Canada that make use of a deep lake…
-

Passenger planes flying too close
Sometimes passenger planes get a little too close to each other on takeoff…
-
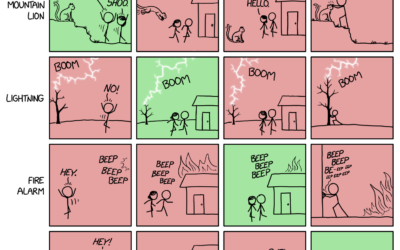
xkcd: Pairwise matrix of what to do in an emergency
xkcd has an informative reference for what do in case of mountain lion…
-
Hip-hop’s influence on the English language
For The New York Times, Miles Marshall Lewis highlights the etymology of five…
-
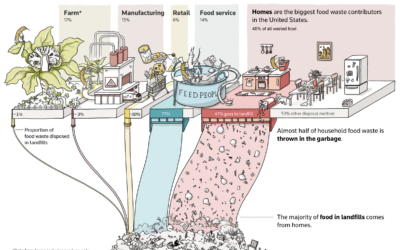
Greenhouse gas from wasting food at home
Almost half of wasted food comes from homes, and almost half of that…
-
Rarity of songwriters who are women for popular songs
It’s common to see singers who are women, but the people who write…
-
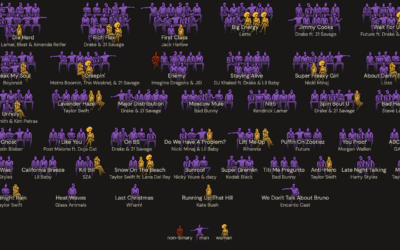
Taylor Swift pop charts
Taylor Swift has been filling up stadiums across the United States and will…
-
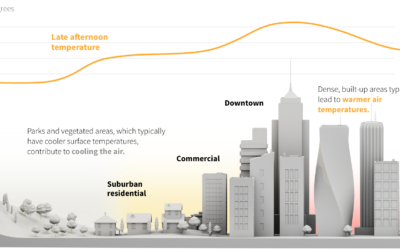
Hot surfaces, stored energy
In hot places, the ground can heat to higher temperatures than the air,…
-
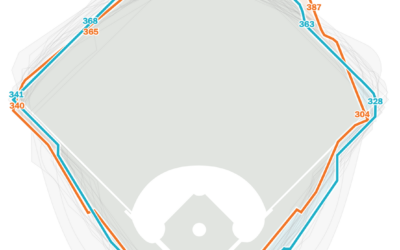
Comparing home run in distance different stadiums
In Major League Baseball, a player hits a home run when the ball…
-
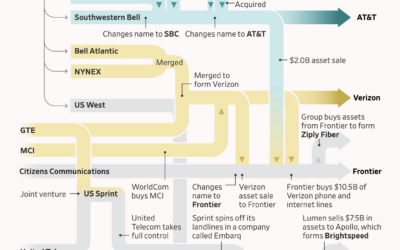
Flowchart showing the splits, mergers, and acquisitions of the former Bell Telephone Company
Bell System’s monopoly broke up in 1984 leading to independent phone companies, which…
-
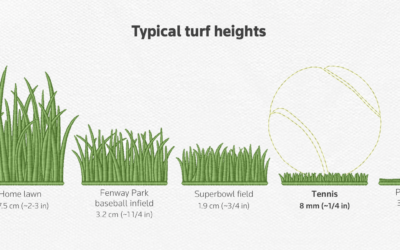
Wimbledon grass patterns
This might surprise you, but the grass at the Wimbledon tennis tournament is…
-
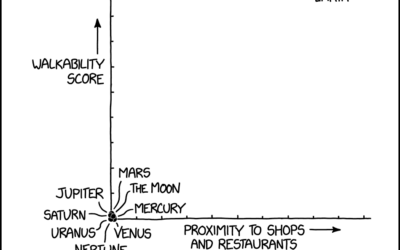
xkcd: Real estate analysis
xkcd provides the analysis we all need. I can’t believe Jupiter scored so…
-

Competitive hot dog eating requirements
Nathan’s Famous hot dog eating contest, so gross to watch but impossible to…
-

Noise and health
The New York Times explores how noise impacts health:
Anyone who lives in… -
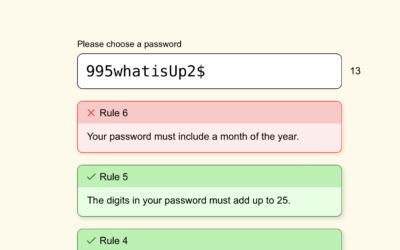
Password game requires more ridiculous rules as you play
Password rules seem to get more strict and weird over time. Neal Agarwal…
Recently for Members
Second Edition
 Visualize This: The FlowingData Guide to Design, Visualization, and Statistics (2nd Edition)
 Visualize This: The FlowingData Guide to Design, Visualization, and Statistics (2nd Edition)
New tools, refined process.
Browse by Chart Type See All →


