For The Washington Post, Pranshu Verma and Shelly Tan illustrate the scale of…
Washington Post
-

Energy used to generate an email with AI
-
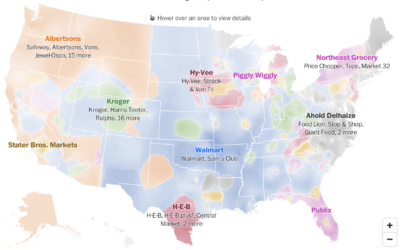
Grocery owner territories
Any day is a good day for a map of predominant commercial chains.…
-

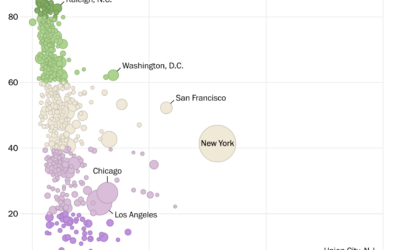
Political leanings of first and last names
For The Washington Post, Andrew Van Dam and Lenny Bronner analyzed names and…
-

Making unrefined vs. refined avocado oil, illustrated
For The Washington Post, Anahad O’Connor and Aaron Steckelberg show the contrast between…
-
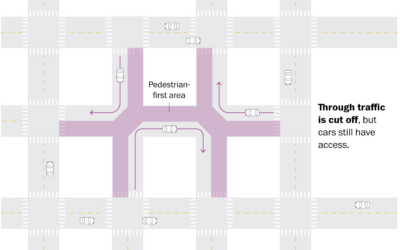
Superblocks, an urban planning compromise for cars and pedestrians
Living in city centers with little space to spend time outside and a…
-
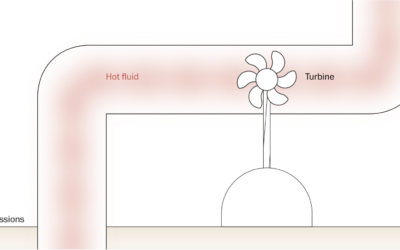
Clean energy from fracking
We usually hear about fracking in a negative context, but for the Washington…
-
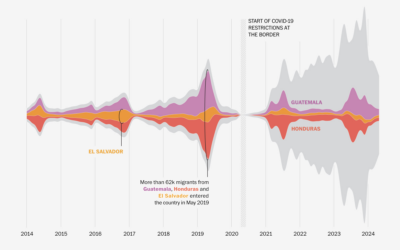
Where immigrants in the U.S. came from
A lot of immigration talk in the U.S. focuses on Mexico, but immigrants…
-
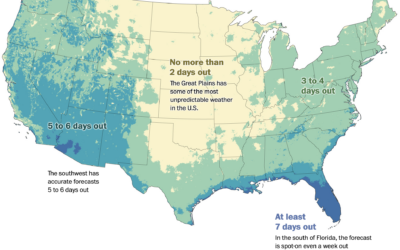
Accuracy of temperature forecasts where you live
You’ve probably noticed that the weather forecast can change a lot for predictions…
-

Age differences between world leaders and the populations they serve
The ages of American presidential candidates are old when compared to the ages…
-
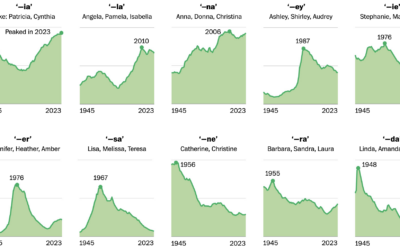
Trendy baby name sounds
For WP’s Department of Data, Daniel Wolfe analyzed baby name data with Laura…
-
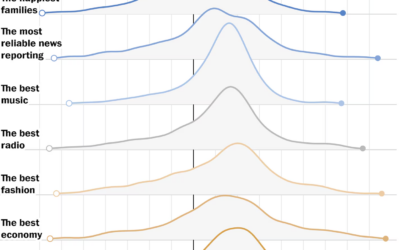
When feelings of nostalgia peak
YouGov surveyed 2,000 adults asking them when was the best and worst decades…
-

Change in housing prices where you live
I don’t know about you, but where I live, the housing prices keep…
-
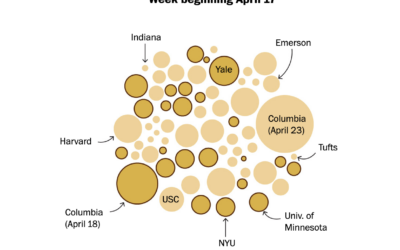
Counts for pro-Palestinian college protests increasing
Based on estimates from the Crowd Counting Consortium, the Washington Post shows the…
-
Access to nature where you live
NatureQuant processes and analyzes satellite imagery to quantify people’s access to nature. They…
-
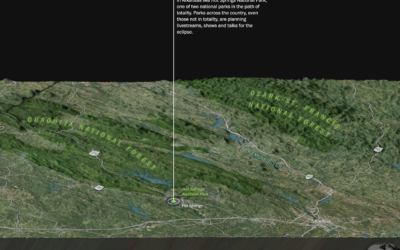
Mile-by-mile map along the path of totality
On April 8, 2024, the moon is going to completely block the sun…
-

Rise of Caitlin Clark, scoring machine
Caitlin Clark, a basketball guard for the University of Iowa, has been steadily…
-

Your body as a processing plant, digesting a hot wing
Your body goes through a special process to digest spicy food. The sting,…
-

Speed puzzling times and strategies
There are competitions where people complete jigsaw puzzles as quickly as they can,…
-
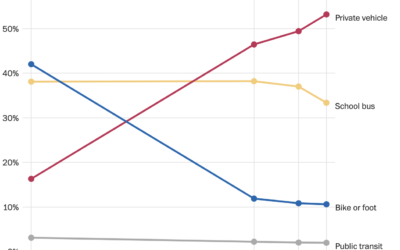
Decline of the school bus
For WP’s Department of Data, Andrew Van Dam notes the decline of the…
-
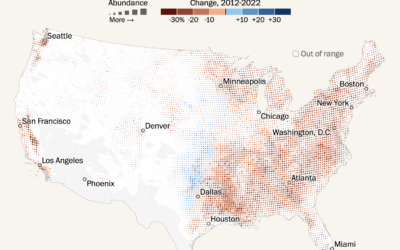
Shifting bird populations
Using data from the crowdsourced database eBird, Harry Stevens mapped the shifts in…
Recently for Members
Second Edition
 Visualize This: The FlowingData Guide to Design, Visualization, and Statistics (2nd Edition)
 Visualize This: The FlowingData Guide to Design, Visualization, and Statistics (2nd Edition)
New tools, refined process.
Browse by Chart Type See All →


