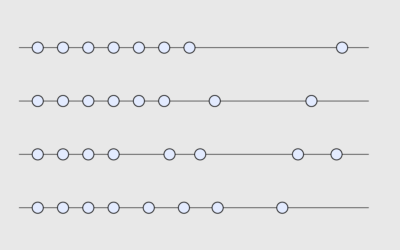
Visualizing time series data often assumes that your data points are evenly spaced over time, which is not always the case.
time series
-
Members Only
Chart Options for When Time Data Has Uneven Gaps
-
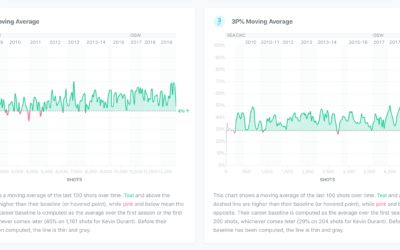
Exploration of players’ shot improvement in the NBA
Wondering whether if a player’s shot improves over the course of his career,…
-
Members Only
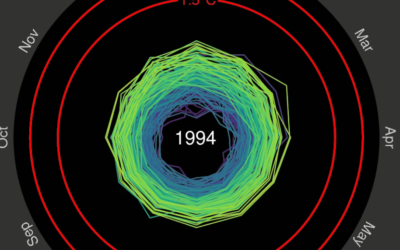
How to Make (and Animate) a Circular Time Series Plot in R
Also known as a polar plot, it is usually not the better option over a standard line chart, but in select cases the method can be useful to show cyclical patterns.
-
Members Only
How I Made That: Searchable Time Series Chart
When there are too many options or categories, it can be helpful to make the data searchable.
-
Prophet for forecasting with a lot of data
Facebook released Prophet, which is a procedure to quickly forecast with time series…
-
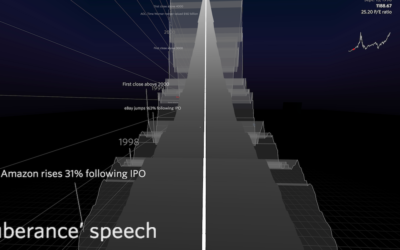
Ride on the VR time series roller coaster
Speaking of virtual reality visualization, this Nasdaq roller coaster by Roger Kenny and…
-
A Course for Visualizing Time Series Data in R
Learn to visualize temporal patterns in a couple of days.
-
Spiraling global temperature chart
Global temperature is on the rise, as most of us know. Ed Hawkins…
-
Members Only
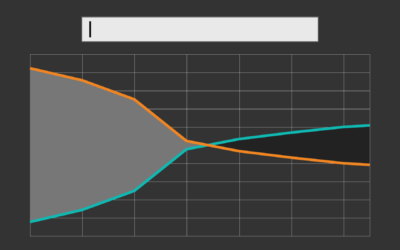
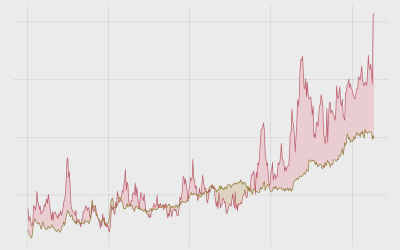
How to Make Bivariate Area Charts in R
Quickly compare two time series variables with this line-area chart hybrid that originated in the 1700s. Also known as: difference chart.
-
Members Only
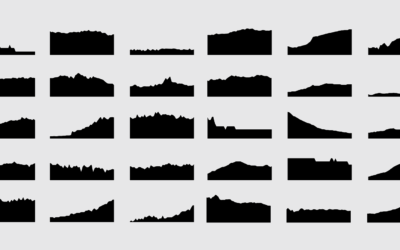
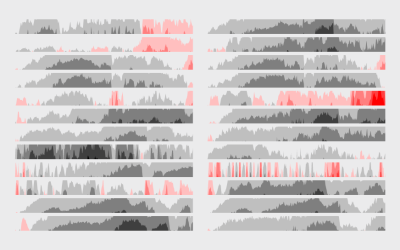
How to Make Horizon Graphs in R
The relatively new and lesser known time series visualization can be useful if you know what you’re looking at, and they take up a lot less space.
-
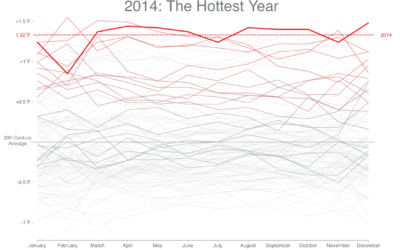
Feeling hot, hot, hot
When you look at overall global temperatures over time, you see a rising…
-
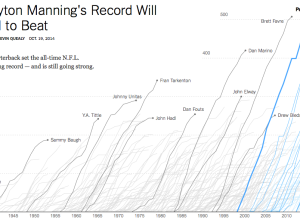
Touchdown passing record
Peyton Manning, quarterback for the Denver Broncos, passed up Brett Favre’s career record…
-
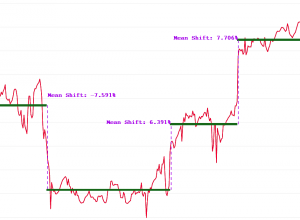
Breakout detection in R
Say you have time series data and you want to detect significant changes,…
-
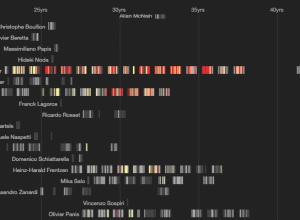
F1 racing winners and age
So here’s a sport I don’t see or hear much about. F1 racing,…
-
Your life on Earth
The BBC has a fun piece that shows changes over your lifetime. Enter…
-
Members Only
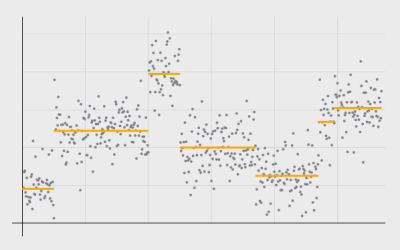
Detecting and Plotting Sequence Changes
Change detection for a time series can be tricky, but guess what, there’s an R package for that. Then show the results in a custom plot.
-
The Change My Son Brought, Seen Through Personal Data
I combed through personal data that I’ve actively and passively collected since early graduate school to see how life is different now with a 6-month old.
-
Link
Quandl
Quandl is a search engine for time series data. Similar to DataMarket, but probably with more straightforward download.
-
Link
Padding a Time Series in R →
Script to fill in the gaps between unevenly spaced points
-
Members Only
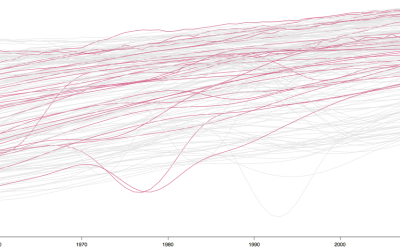
Interactive Time Series Chart with Filters
Time series charts can easily turn to spaghetti when you have multiple categories. By highlighting the ones of interest, you can direct focus and allow comparisons.



 Visualize This: The FlowingData Guide to Design, Visualization, and Statistics (2nd Edition)


