Phew. Close call.
New York Times graphics editor Gregor Aisch noted during a…
interactive
-
Interactive visualization is still alive
-
Interactive or not to interactive visualization?
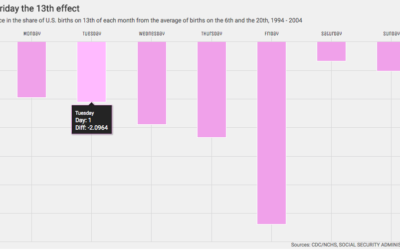
In a recent talk, New York Times graphics editor Gregor Aisch noted that…
-
Interactive charts in R
Interactive charts in R are still so-so, but if you don’t mind giving…
-
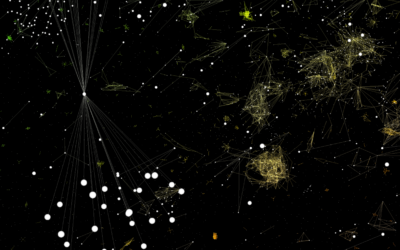
Interactive lets you fly through a software galaxy
This is a fun one. Software Galaxies by Andrei Kashcha visualizes popular software…
-
How to Make Interactive Linked Small Multiples
Small multiples are great, and the right interactions can make them even better. A primer and a how-to.
-
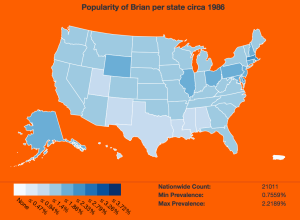
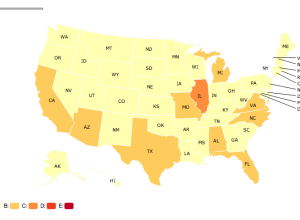
Name popularity by state, animated by year
Using baby name data from the Social Security Administration, Brian Rowe made this…
-
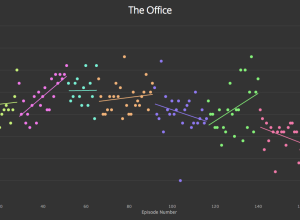
Graph TV shows ratings by episode
Kevin Wu made a straightforward interactive that lets you see IMDB television ratings…
-
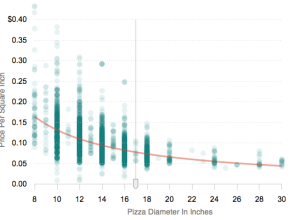
Why you should buy the bigger pizza
Because you get more pizza to eat, and if you don’t finish it,…
-
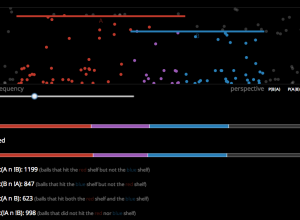
A visual explanation of conditional probability
Victor Powell, who has visualized the Central Limit Theorem and Simpson’s Paradox, most…
-
Interactive maps with R
You can make static maps in R relatively well, if you know what…
-
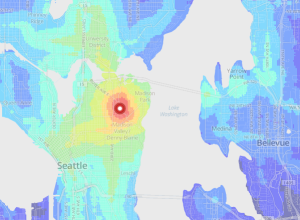
Public transit times in major cities
Last year, WNYC made an interactive map that shows transit times in New…
-
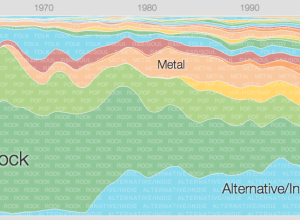
Music timeline of plays and history
Two Google research groups, Big Picture and Music Intelligence, got together and made…
-
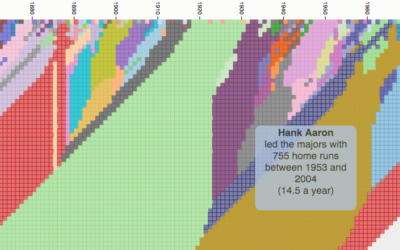
Cherry picking years for random sports statements
When you watch sports, it can sometimes feel like the stat guy pulls…
-
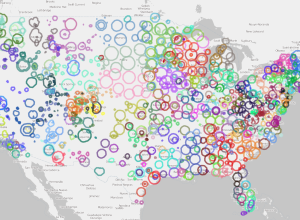
Where the public radio is
Andrew Filer mapped the reach of public radio stations in the United Stations,…
-
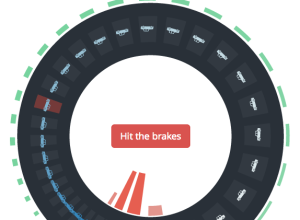
Why traffic waves and congestion happen
You’re on the freeway, traffic is moving along, and for no apparent reason…
-
Degrees of separation between athletes from different sports
You’ve probably heard of the six degrees of Kevin Bacon. The idea is…
-
Planet and moon resizer
It can be difficult to imagine the scale of planets and moons, because…
-
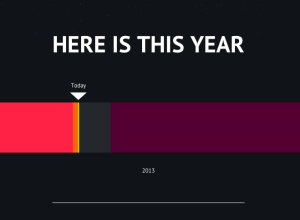
Putting today into perspective
When you focus on all the small events and decisions that happen throughout…
-
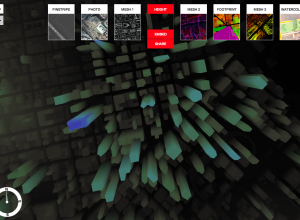
An experimental map service using 3-D data
For the past few months, Stamen Design has been working with 3-D data…
-
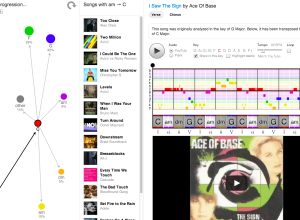
Interactive: Common chord progressions in 1,300 songs
If you listen to the radio long enough, you’ve probably noticed that many…


 Visualize This: The FlowingData Guide to Design, Visualization, and Statistics (2nd Edition)


