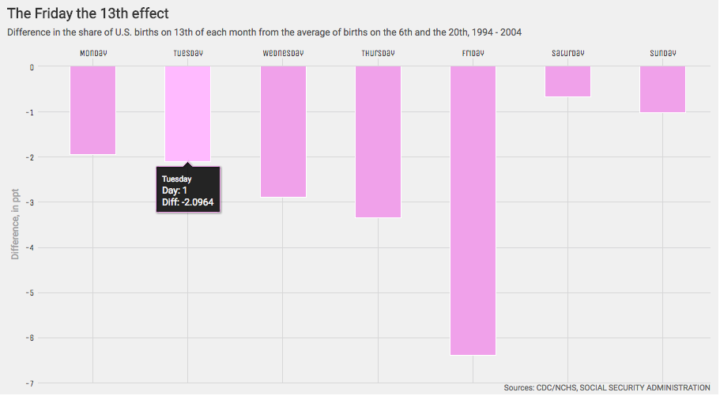
Interactive charts in R are still so-so, but if you don’t mind giving up some flexibility and just want something quick without having to learn a new language, there are a handful of options. RStudio highlights the highcharter package, which is a wrapper around the JavaScript-based Highcharts.
So the story goes that Torstein Hønsi, the founder and Chief Product Officer of Highcharts. was looking for a simple charting tool for updating his homepage with snow depth measurements from Vikjafjellet, the local mountain where his family keeps a cabin. Frustrated with the common flash plug-ins, and other proprietary solutions available at the time, he decided to build a standards-based solution of his own and then, of course, share it.
Write R. Get an interactive chart to export.
While we’re at it, you might also be interested in the R wrapper for Plotly, which is another JavaScript charting library, and htmlwidgets, which lets you work with JavaScript libraries within R (and highcharter makes use of).


 Visualize This: The FlowingData Guide to Design, Visualization, and Statistics (2nd Edition)
