Will Chase, who specialized in visualization for epidemiological studies in grad school, outlined…
coronavirus
-
Not making Covid-19 charts
-
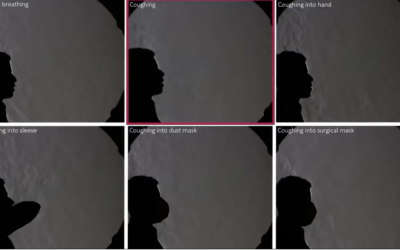
Different cough coverings, varying air spread
From researchers at Bauhaus-University Weimar, this video shows how various methods of covering…
-
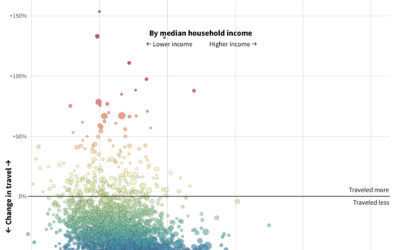
Social distancing isn’t available for everyone
For Reuters, Chris Canipe looks at social distancing from the perspective of household…
-
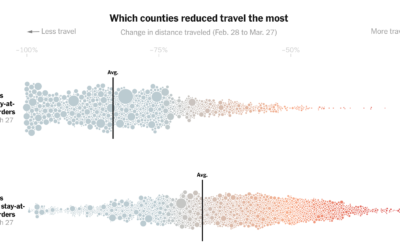
County stay-at-home orders and change in distance traveled
Based on cellphone data from Cuebiq, The New York Times looked at how…
-
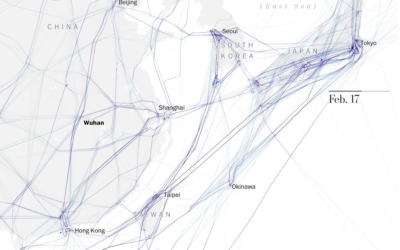
Maps of grounded flights after Covid-19
As you would expect, not many people are flying these days. The Washington…
-
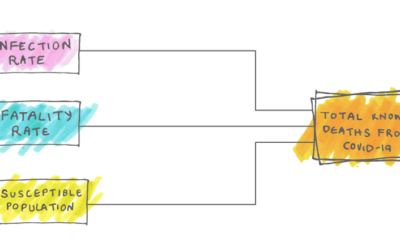
Challenges of making a reliable Covid-19 model
Fatalities from Covid-19 range from the hundreds of thousands to the millions. Nobody…
-
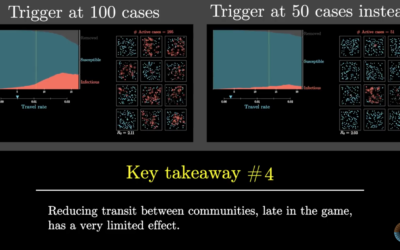
Simulating an epidemic
3Blue1Brown goes into more of the math of SIR models — which drive…
-

Toilet Paper Calculator
Maybe you’re starting to run low. Here’s how much you’ll need when you go to restock.
-
Coronavirus data at the state and county level, from The New York Times
Comprehensive national data on Covid-19 has been hard to come by through government…
-
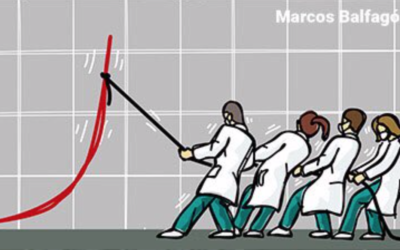
Now pull
A comic by Marcos Balfagón attaches action to the curve.…
-
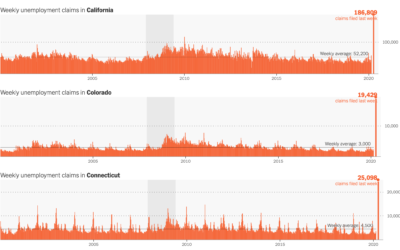
Unemployment spike
The Department of Labor released the numbers for last week’s unemployment filings. 3.28…
-
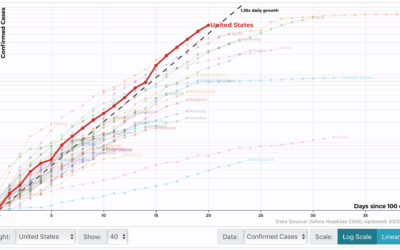
Track confirmed Covid-19 cases by country, state, and region
Wade Fagen-Ulmschneider made a set of interactive charts to track confirmed coronavirus cases.…
-
For Everyone Else
In a Channel 4 clip, Hugh Montgomery does some back-of-the-napkin math contrasting the normal flu against the coronavirus. Here’s a chart version.
-

Break the chain
For The Spinoff, Toby Morris illustrates how individuals can break a chain of…
-
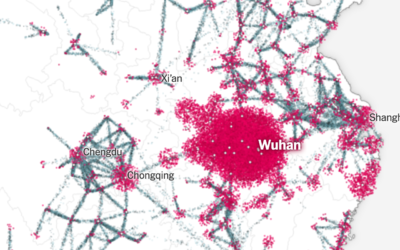
Particle flows show how the coronavirus ramped up
Using a combination of estimates based on cell phone movements and outbreak size,…
-

Coronavirus Explained and What You Should Do
Kurzgesagt, which make videos to explain complex and abstract concepts in an understandable…
-

How washing your hands for 20 seconds does the trick
Vox used a lotion that mimics viruses to demonstrate the power of washing…
-
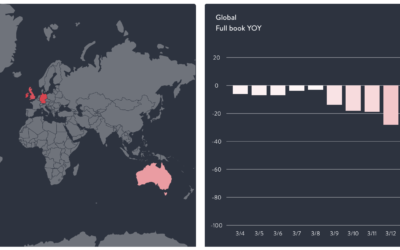
Restaurant struggles
The restaurant industry is taking a big hit right now, as most people…
-
Members Only

Simulating the Unknown; Working From Home – The Process 081
We don’t know what’s going to happen in the future, but we can look at what we do know and make our best guess.
-
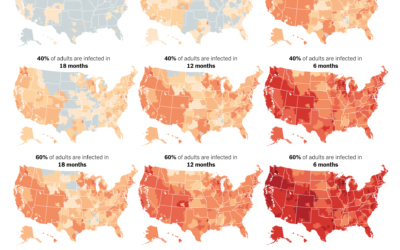
Hospital bed occupancy
Using estimates from the Harvard Global Health Institute, The Upshot mapped what hospital…
Recently for Members
Second Edition
 Visualize This: The FlowingData Guide to Design, Visualization, and Statistics (2nd Edition)
 Visualize This: The FlowingData Guide to Design, Visualization, and Statistics (2nd Edition)
New tools, refined process.
Browse by Chart Type See All →


