Toilet Paper Calculator
Those who stored up on toilet paper until summer are probably set, but I suspect a good number of people are starting to run low. When you go to restock, here’s a calculator to figure out how much you need to buy.
If you want to know how many rolls you need for a different number of days, just multiply the per day average by the numbers of days you want.
Of course, the better your estimates on the sliders, the better the estimate for the total roll count will be. To test this out, I started paying closer attention to usage in my own household and I was surprised by the number of squares on each wipe and number of wipes total.
The wide variation of toilet paper roll sizes was also suprising.
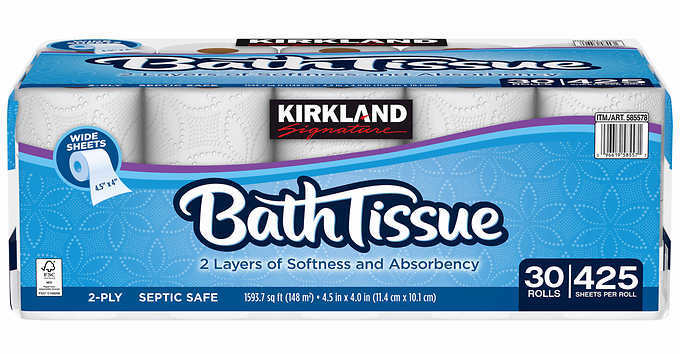
A standard roll from Costco has 425 sheets. But if you get that Ultra Comfort Care from Cottonelle, you only get 121 sheets. Unless you get Mega roll, in which case you get 284 sheets. Going the other direction, the single ply toilet paper has 1,000 sheets per roll (although you probably end up using more per wipe).
Then packs come in different sizes. So you’ll probably have to get some surplus. Maybe use the extra rolls to barter for some N95 masks and donate to your local hospital.
Toilet Paper Alternatives
There are other ways to clean yourself. In some places, toilet paper isn’t even really a thing. Maybe it costs too much. Maybe it wreaks havoc on the plumbing. Maybe it’s just preference.
Here are some alternatives:
- Bidet — It’s part of your toilet seat and sprays a stream of water to clean you off. It’s actually kind of refreshing once you get used to it.
- Rags or old socks — Wash after each use.
- Leaves — Probably bigger ones are better. I cannot speak from experience.
- Some other water source — Use a squirt bottle or spray bottle.
So just in case you run out of toilet paper, take a breath. There’s probably still a way to clean yourself. If all else fails, you have your hand and a generous amount of soap.
Chart Type Used

Become a member. Support an independent site. Get extra visualization goodness.
See What You Get