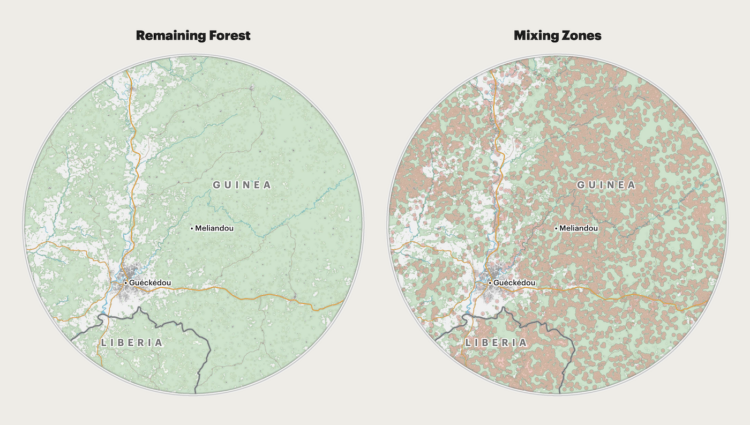
For ProPublica, Al Shaw, Irena Hwang, and Caroline Chen explain the increased risk of spreading disease when there are fewer trees and physical barriers in between people:
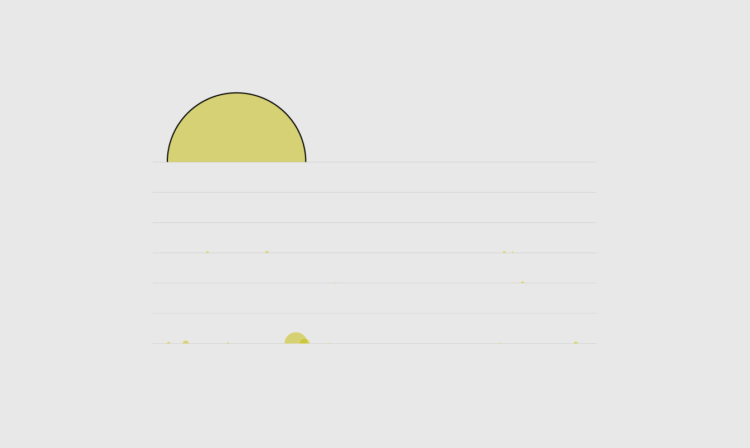
The implications of such a drastic increase in mixing zone area over a relatively small increase in deforestation are serious. In 2018, a team led by Christina Faust, a researcher at the University of Glasgow, Scotland, developed a peer-reviewed model that directly links changes in forest cover to the potential for spillover events. To understand how the potential for spillover had changed since the 2013 outbreak, we applied data from real-world satellite images to this theoretical model.
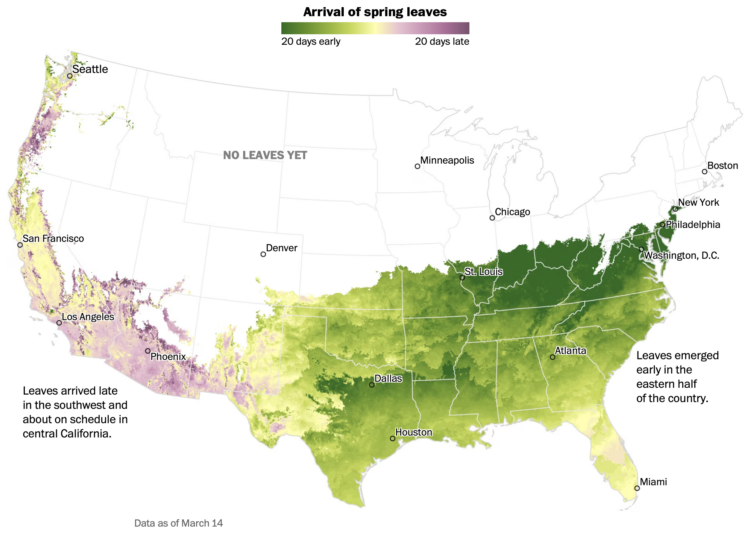
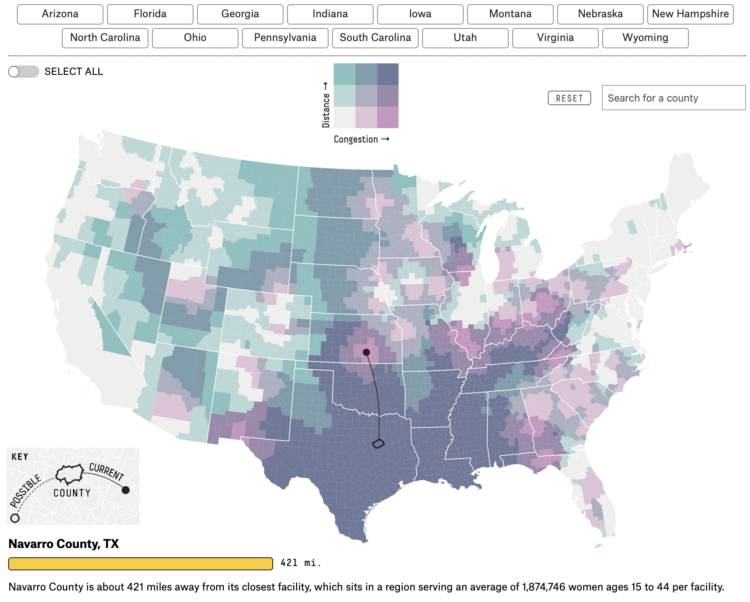
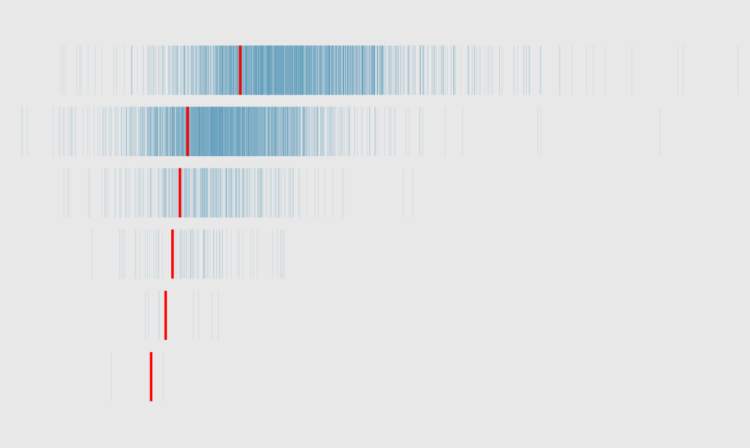
The dot plot and map combo at the end is a nice touch.


 Visualize This: The FlowingData Guide to Design, Visualization, and Statistics (2nd Edition)


