The simple analysis is to approach data blind, as machine output. But this almost always produces an incomplete analysis and a detached, less than meaningful visualization. Jacob Harris, a developer at the New York Times, talks context, empathy, and what the dots represent.
In reference to the New York Times’ map of deaths in Baghdad after receiving the Wikileaks war logs:
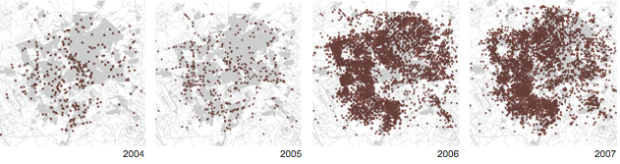
Before it was a final graphic though, it was a demo piece I hastily hacked into Google Earth using its KML format. I remember feeling pretty proud of myself at how cool even a crude rendering like this looked, and the detailed work I had done to pull out all the data within reports to see these dots surge and wane as I dragged the slider. Then I remembered that each of those data points was a life snuffed out, and I suddenly felt ashamed of my pride in my programming chops. As data journalists, we often prefer the “20,000 foot view,” placing points on a map or trends on a chart. And so we often grapple with the problems such a perspective creates for us and our readers—and from a distance, it’s easy to forget the dots are people. If I lose sight of that while I am making the map, how can I expect my readers to see it in the final product?


 Visualize This: The FlowingData Guide to Design, Visualization, and Statistics (2nd Edition)


