• The Gulf of Mexico has been renamed to the Gulf of America in the Geographic Names Information System (GNIS) by the U.S. Geological Survey. When you search for the gulf on USGS, you get the following result that defaults to Gulf of America.

    Only the main title changed though. “Research in the Gulf of Mexico” appears underneath and if you follow the link, Mexico is the point of reference.

    But now, when you search Google Maps, which follows the naming defined by the GNIS, you get the Gulf of America, as shown above. As of the evening of February 10, 2025, Apple Maps still shows the Gulf of Mexico:

    It’s shocking how quickly the names can change in the system. The GNIS started in the 1970s. How many times have geographic areas and features changed over the years? Is there a space that has been renamed many times?

    From Google:

    In the U.S., the Geographic Names Information System (GNIS) has officially updated “Gulf of Mexico” to “Gulf of America.” As we announced two weeks ago and consistent with our longstanding practices, we’ve begun rolling out changes to reflect this update. People using Maps in the U.S. will see “Gulf of America,” and people in Mexico will see “Gulf of Mexico.” Everyone else will see both names.

    I honestly thought this was a joke.

  • I missed this one last week, pre-Super Bowl, but for The Washington Post, Artur Galocha highlighted self-censoring during the Super Bowl halftime show to comply with FCC regulations. It seems Kendrick Lamar was still able to get his point across with lyric substitutions.

  • Hank Azaria, who does the voices for many characters on The Simpsons, wrote an op-ed for The New York Times on craftsmanship and AI:

    If A.I. tries to recreate one of my voices, what will the lack of humanness sound like? How big will the difference be? I honestly don’t know, but I think it will be enough, at least in the near term, that we’ll notice something is off, in the same way that we notice something’s amiss in a subpar film or TV show. When the exposition is clunky or there’s a bad bit of dialogue or a character says something that’s out of character — why would he say that if he was afraid? Why did she just announce her back story like that? Et cetera.

    It adds up to a sense that what we’re watching isn’t real, and you don’t need to pay attention to it. Believability is earned through craftsmanship, with good storytelling and good performances, good cinematography and good directing and a good script and good music.

    I hope he’s right, for all of our sakes.

    For data analysis and visualization specifically, it’s getting easier to plug in data and get output that looks useful, but a closer look often shows something is off. Although you might not know it if you don’t work with data regularly. Quality control will be vital.

  • Messing with how emojis are encoded, Paul Butler demonstrates how one might hide data via a smiley:

    Most unicode characters do not have variations associated with them. Since unicode is an evolving standard and aims to be future-compatible, variation selectors are supposed to be preserved during transformations, even if their meaning is not known by the code handling them. So the codepoint U+0067 (“g”) followed by U+FE01 (VS-2) renders as a lowercase “g”, exactly the same as U+0067 alone. But if you copy and paste it, the variation selector will tag along with it.

    Since 256 is exactly enough variations to represent a single byte, this gives us a way to “hide” one byte of data in any other unicode codepoint.

    Use this simple tool to give it a whirl 😀󠄼󠅟󠅞󠅗󠄐󠅜󠅙󠅦󠅕󠄐󠅤󠅘󠅕󠄐󠅔󠅑󠅤󠅑󠄐󠅠󠅟󠅙󠅞󠅤󠄞.

  • To contain the fires in Los Angeles, aircraft flew back and forth to drop retardant and survey the area for several days. Peter Atwood used an animated map to show 24 hours of activity, totaling over 15,000 flight miles.

    Atwood used wildfire data from NASA, the ArcGIS Living Atlas for terrain, and FlightAware data for the flights. The neon aesthetic highlights the patterns and urgency of each aircraft’s travels.

  • According to the U.S. Office of Personnel Management, about 65,000 federal workers have taken the resignation offer. The New York Times puts that number into context, given the size of the federal workforce.

    In other words, the federal government is an enormous work force that already experiences sizable turnover every year. In addition to workers who leave the government to retire or simply to quit, about another 50,000 to 60,000 are terminated every year for disciplinary or performance reasons, or because their appointments or funds expired. A small number — around 3,400 — die each year while employed by the government. All these departures are typically replaced by about 240,000 hires each year.

    While the resignation count might seem large, the denominator is a lot bigger.

  • The Harvard Law School Library Innovation Lab is archiving Data.gov and making the data easy to download. So far, they have a collection of 311,000 datasets:

    This is the first release in our new data vault project to preserve and authenticate vital public datasets for academic research, policymaking, and public use.

    We’ve built this project on our long-standing commitment to preserving government records and making public information available to everyone. Libraries play an essential role in safeguarding the integrity of digital information. By preserving detailed metadata and establishing digital signatures for authenticity and provenance, we make it easier for researchers and the public to cite and access the information they need over time.

    You can download the daily archive here.

    They also open sourced the software for others to build similar collections. Great.

  • Members Only

    This week, I have a new tutorial for you and then we get into using data with baggage.

  • About 1 in 10 people use the same four-digit PIN, based on an analysis of Have I Been Pwned? data by Julian Fell and Teresa Tan for ABC News:

    Even though there are 10,000 possible combinations, when humans get involved that equation changes dramatically.

    If someone wants to unlock a stolen phone – or retrieve money from an ATM – and only have five guesses, this data suggests they still have a one-in-eight chance of guessing correctly.

    The scroll through the heatmap of PIN numbers, which shows the first two digits on the vertical axis and the last two digits on the horizontal, drives the point home. Maybe stay away from the diagonal and horizontal lines.

  • The Hamilton Project is tracking federal expenditures and updating daily:

    This data interactive shows actual daily and weekly processed outlays to key programs and departments, as well as to states, Congress, and the Judiciary. This tool only reports outlays of federal funds, meaning the actual transmission of funds from the federal government to another entity. This tool, therefore, allows users to track federal government spending in real time.

    The data comes from the Daily Treasury Statement from the U.S. Department of the Treasury, so it’s anyone’s guess how long that will last. But for now, you can see where money is going in near real-time.

  • The data portal for the U.S. Centers for Disease Control and Prevention was taken down last Friday. For now, it seems data.cdc.gov is up in a modified form, but just in case, the Internet Archive has all the data that was available prior to January 28, 2025.

    The compressed data file is only 95 gigabytes, so maybe just download it now.

  • As of this evening on February 4, 2025, the TIGER/Line shapefiles, which provide legal boundaries at various geographic levels, are currently unavailable on the Census website. The site is there, but when you try to download something via the menus, you get a box of nothing.

    Actually, poking around more, it seems that any Census web interface that relies on downloads via FTP gets you a 403 error. Data.census.gov is still up.

    In the meantime, IPUMS, which has worked with national agencies over the past couple decades, still has microdata. They sent this email earlier today:

    As you may already be aware, on Friday, January 31, federal agencies removed public data and documentation previously made available via public-facing federal government websites in response to administration directives. The types of data removed include large-scale population data sources that provide vital insight into the health and wellbeing of all communities.

    We are writing to reassure you that IPUMS data remain available, and that IPUMS remains committed to preserving and democratizing access to the world’s population data.

    We are monitoring this evolving situation closely. As part of our standard procedures, we download and preserve original data from U.S. statistical agencies that serve as the source data for IPUMS. Since last Friday, several organizations (and individuals) have downloaded many other public federal datasets. There are efforts underway to catalog and make these data available. We will share resources and guidance when we have it about how to locate or share missing data.

  • Data Beads, by Eszter Katona and Mihály Minkó, is a fun initiative that encourages people to make and wear bracelets based on data:

    This is a grassroots initiative that’s all about brining data visualization into a whole new space—off the screen and into wearable, everyday objects. We turn data into simple, easy-to-make bracelets, making data more approachable and fun.

    These bracelets aren’t just accessories: they’re conversation starters that help break the ice around different topics, data and graphs, which can be difficult for many people to engage with. At the same time, we hope they spark curiosity and improve data literacy in a casual, creative way.

    I suddenly wish the short-lived Shirt Project was still going.

  • Ridgeline Chart with Color Gradients

    Ridgeline charts are nice to look at, and that is enough reason to make them. Use a gradient fill for extra sauce.

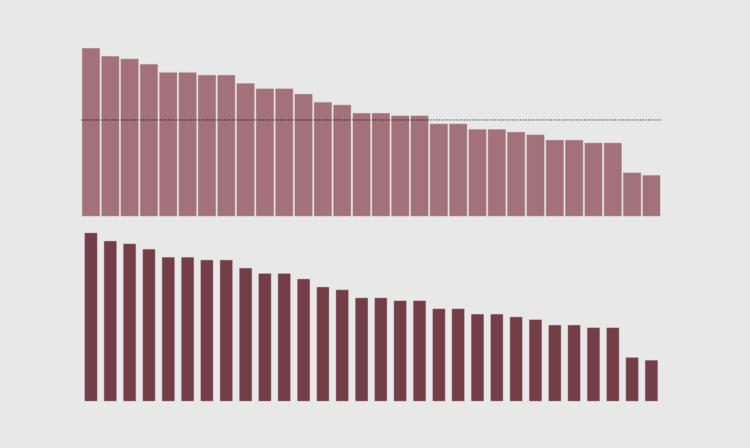
  • I assumed that Barnes & Noble was on its way out, but I guess not. Danielle Alberti and Lindsey Bailey for Axios have this charming chart showing 57 new locations in 2024 and 60 planned for this year. Each book spine represents a location.

    I’m taking this as a cue that people are weaning off the internet, which is getting worse, and it’s not just my imagination.

  • For The Verge, Justine Calma reports on the recent takedowns. Some groups have been preparing for this:

    The End of Term Web Archive project has saved content on federal government websites during every presidential transition since 2008. The Environmental Data and Governance Initiative (EDGI) that formed after Trump was first elected also documents changes to government websites and works to make archived datasets available elsewhere. It has backed up data from the CDC’s Social Vulnerability Index and Environmental Justice Index and shared it on a webpage for The Public Environmental Data Project.

    Yet even if these datasets have been archived, they aren’t as helpful when they aren’t updated. “Any dataset has a lifespan of utility,” says Dan Pisut, senior principal engineer at GIS software company Esri.

    Of course, this is just the beginning. Remember: marathon, not sprint.

  • The New York Times used a programmatic approach to estimate the number of pages taken down so far since Friday. Ethan Singer reporting:

    On Friday, The Times downloaded the list of the most visited government domains in the U.S. and began compiling the complete list of pages available on each one using each site’s sitemap, a file that outlines the structure of a website and is typically used by search engines to keep track of what’s on the internet. (Some sites, including state.gov and weather.gov, were not included in our analysis because we were unable to identify a complete list of web pages on their sites, or for other technical reasons.) In all, we were able to identify more than seven million pages across more than 150 sites.

    We then repeated this process several times Friday night and on Saturday, and compared our new list of websites with those we originally found.

    About 3,000 pages from the Centers for Disease Control and Prevention, 3,000 from the Census Bureau, and 1,000 from the Office of Justice Programs make up the bulk of takedown.

  • In preparation for days like this, MIT Libraries has a guide for making usable backups:

    The United States (US) federal government collects, aggregates, and disseminates a large volume of information and data. This content is used by researchers, policymakers, and many others for various purposes.

    Protecting access to US federal government data between and during presidential administrations is important. Data can potentially disappear because of government shutdowns, broken links, and policy shifts.

    This checklist provides steps you can take to ensure the government data you use in your research remains accessible to you and others.

    Identify the data, confirm, backup with documentation, and maintain re-usability.

  • Groups at universities and research labs are forming to preserve data. Naseem Miller reports:

    The ad hoc group that organized Friday’s data marathon at Chan School calls itself “The Preserving Public Health Data Collective” and it’s part of a growing effort among researchers and academic institutions across the U.S. to save federal health websites and databases.

    Researchers are using different tools, including downloading datasets, scraping websites and archiving them with the Wayback Machine, which is an initiative of the Internet Archive, a nonprofit digital library of Internet sites. It enables users to see how websites looked in the past.

    The changes to government websites are happening faster than researchers can keep up with.

    There are some tips on how you can preserve websites, including saving them to the Wayback Machine and suggesting databases to The Data Liberation Project.

  • As of this evening on January 31, 2025, the data portal for the Centers for Disease Control and Prevention is offline. You get the following text:

    Data.CDC.gov is temporarily offline in order to comply with Executive Order 14168 Defending Women From Gender Ideology Extremism and Restoring Biological Truth to the Federal Government and the OPM notice dated January 29, 2025, “Initial Guidance Regarding President Trump’s Executive Order Defending Women from Gender Ideology Extremism and Restoring Biological Truth to the Federal Government (Defending Women).” The website will resume operations once in compliance.

    The takedown is part of a directive to halt research and cut funding. From Roni Rabin and Apoorva Mandavilli for The New York Times:

    On Friday, hundreds of scientists gathered for a “datathon,” in an attempt to preserve websites related to health equity.

    “There’s been a history in this country recently of trying to make data disappear, as if that makes problems disappear,” said Nancy Krieger, a social epidemiologist at Harvard University and a co-leader of the effort.