The Washington Post visualized 13,000 school districts to show the change in diversity…
Infographics
Telling stories with data and graphics.
-
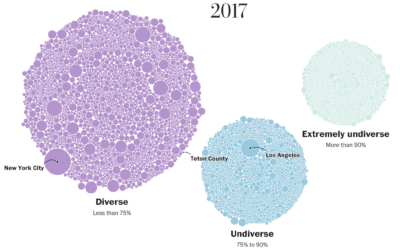
School diversity visualized with moving bubbles
-
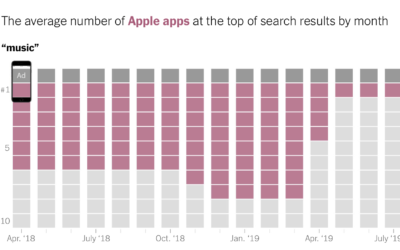
Stacking Apple apps in the App Store
For The New York Times, Jack Nicas and Keith Collins stack up app…
-

A sim to show self-driving car challenges
On the surface, driving a car might seem fairly straightforward. Follow the rules…
-

All of the plastic bottles purchased in a day, Eiffel Tower for scale
Millions of plastic bottles are purchased every day around the world. What does…
-

History of slavery in America
USA Today looks at some of the numbers on 17th century slavery in…
-
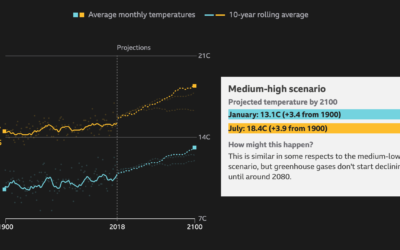
How much warmer your city will get
BBC News asks a straightforward question: How much warmer is your city? Enter…
-

Democratic candidates who Iowa fairgoers could name
In a “radically unscientific survey” Kevin Uhrmacher and Kevin Schaul for The Washington…
-
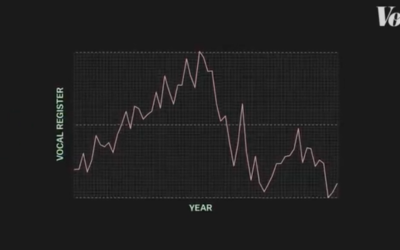
Measuring pop music’s falsetto usage
Vox and Matt Daniels delved into falsetto in pop music over the years.…
-
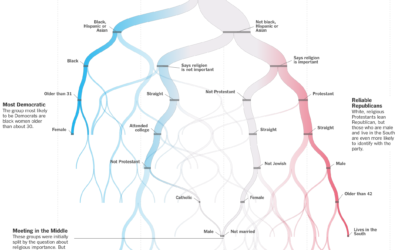
Predicting whether you are Democrat or Republican
The New York Times is in a quizzy mood lately. Must be all…
-

Everyday charts book
Add a book to the humorous-charts-documenting-the-everyday genre. Am I Overthinking This? by Michelle…
-

Light from the center of the galaxy
This animated interactive explains how a research group is using light to measure…
-
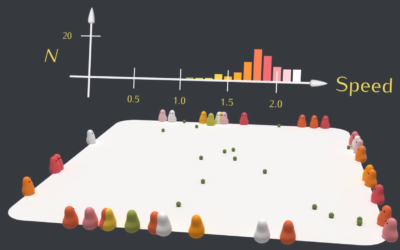
Natural selection simulation
Using blobbies with varying traits such as size, speed, and food gathering ability,…
-
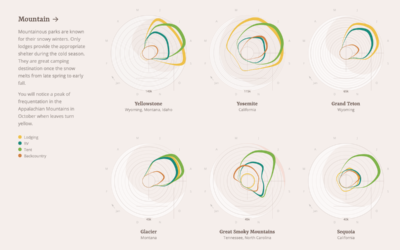
Peak accommodation type at national parks
When staying at national parks, some people choose a tent. Some bring an…
-

Isotype, a picture language
Jason Forrest delves into the history of a single Isotype and a bit…
-

Modern reproduction of an 1868 catalog of flower illustrations
Nicholas Rougeux, who has a knack and the patience to recreate vintage works…
-

Data-driven hipster reading list
When it comes to reading lists, we usually look for what’s popular, because…
-

Atlas of all the moons in our solar system
National Geographic went all out on their atlas of moons. Space. Orbits. Rotating…
-
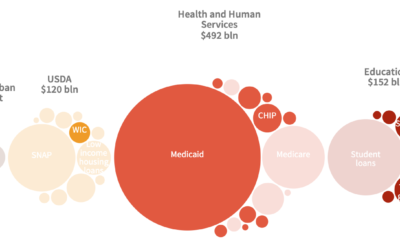
Cost of a Census undercount
The citizenship question for the upcoming Census is still stuck in limbo. One…
Recently for Members
Second Edition
 Visualize This: The FlowingData Guide to Design, Visualization, and Statistics (2nd Edition)
 Visualize This: The FlowingData Guide to Design, Visualization, and Statistics (2nd Edition)
New tools, refined process.
Browse by Chart Type See All →


