Matt Hong used a stacked bar chart over time as the frame for…
Infographics
Telling stories with data and graphics.
-

Data comic shows an average American day
-

High school basketball players who make it to the NBA
Right in my wheelhouse, Russell Goldenberg and Amber Thomas for The Pudding looked…
-
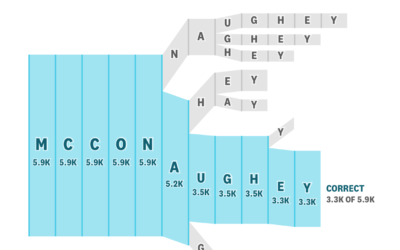
Celebrity name spelling test
Colin Morris culled common misspellings on Reddit and made the data available on…
-

Searching for the saddest punt ever, with statistics
For SB Nation, Jon Bois takes a statistical deep dive in the search…
-
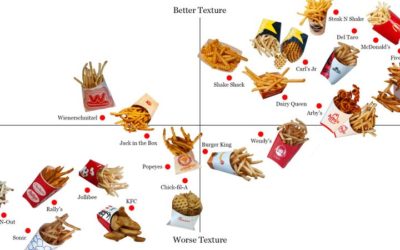
French fry power rankings
Lucas Kwan Peterson for the Los Angeles Times ranked fast food french fries.…
-

Scale of Star Wars characters and ships
It’s the scale of significant Star Wars characters, objects, and ships from Episode…
-

Evolution of the periodic table of elements
As more elements were discovered, the table grew and changed layout. For Science…
-

Evolution of the alphabet
Matt Baker provides this nifty diagram on how the alphabet changed over the…
-

Closeness in relationships over time, illustrated with a couple of lines
Cartoonist Olivia de Recat illustrated the closeness over time for various relationships. Charming.…
-
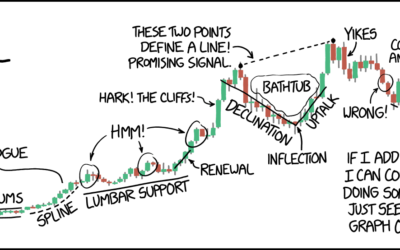
xkcd: technical analysis
Seems about right.…
-

Scale of tens
I’m always up for some scaled perspective. From David Packer:
Anyone need a…
-

Real-time speed of light from Earth to Mars
Hurry up, light. We’re gonna be late:
By James O’Donoghue, the animation shows… -
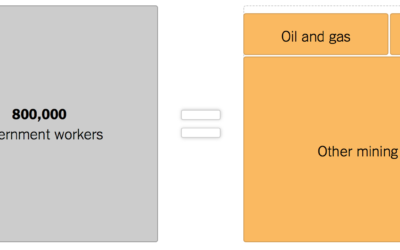
Government shutdown, other industries provided for scale
As the shutdown continues, 800,000 government workers wait for something to happen. The…
-
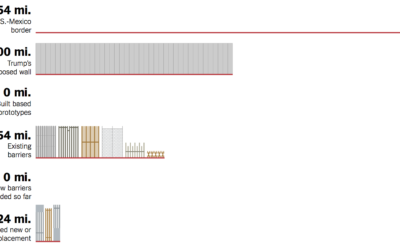
Border wall progress chart
Denise Lu for The New York Times provides a quick overview of the…
-

Kernel density estimation explainer
Matthew Conlen provides a short explainer of how kernel density estimation works. Nifty.…
-

Top NBA player by zone
Kirk Goldsberry is back at ESPN. I put this here mainly because it’s…
-

Modern reproduction of 1847 geometry books
Euclid’s Elements is a series of 13 books produced in 300 BC that…
-
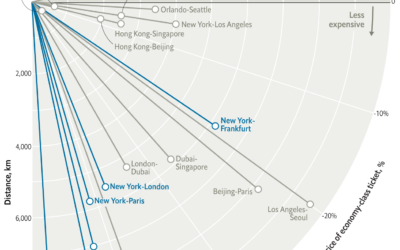
Falling ticket prices for longer flights
Based on data from Expedia, this is an interesting one from The Economist.…
Recently for Members
Second Edition
 Visualize This: The FlowingData Guide to Design, Visualization, and Statistics (2nd Edition)
 Visualize This: The FlowingData Guide to Design, Visualization, and Statistics (2nd Edition)
New tools, refined process.
Browse by Chart Type See All →


