I have a feeling we’re in for a lot of manipulated videos as…
Infographics
Telling stories with data and graphics.
-

Guide to manipulated video
-

Scale of the Hong Kong protest
You know those sped up videos where there’s a long line for something…
-
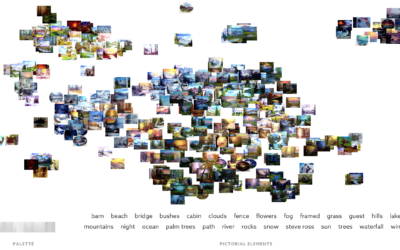
Mapping Bob Ross
Fathom Information Design recently made tools to find patterns in documents of text.…
-
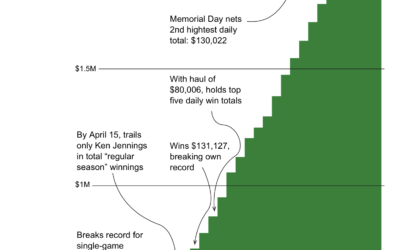
Jeopardy! winners making chart jokes
James Holzhauer is on a record-breaking Jeopardy! win streak. It’s not so much…
-

Why some Asian accents swap Ls and Rs
Vox delves into why Ls and Rs often get replaced by Asian speakers…
-

Rise of the summer sequel
For The New York Times, Keith Collins shows the growing popularity of summer…
-
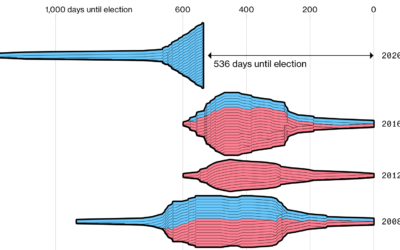
More candidates and earlier
For Bloomberg, Lauren Leatherby and Paul Murray describe the heightened eagerness to enter…
-

Sprawlball, an in-depth look into the evolution of modern basketball
If you’ve seen a basketball shot chart in the past few years, it…
-
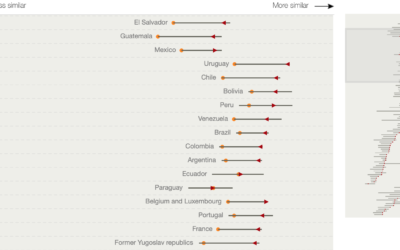
Growing similarity in global diet
Diet around the world is growing more similar. National Geographic charted estimates of…
-

Amount of fish to raise a big fish
Raising living things requires resources. In the case of fish, it requires more…
-

A more detailed view of the Mueller Report
By now we’ve all seen the zoomed out thumbnail view of the Mueller…
-

What happened at Notre-Dame
Notre-Dame in Paris, France was on fire. The New York Times describes what…
-
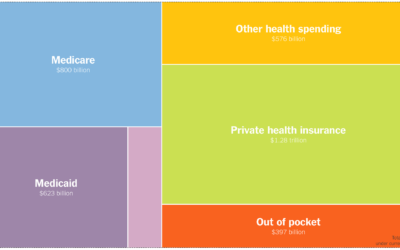
Comparing the potential cost of Medicare for everyone
For The Upshot, Josh Katz, Kevin Quealy, and Margot Sanger-Katz, consulted economists to…
-
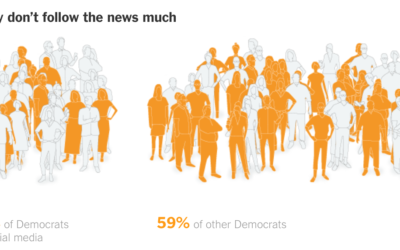
Contrasting social media Democrats to real life
As many know (I hope), what we see on social media often doesn’t…
-

All of the deaths in Game of Thrones
A few years back, The Washington Post illustrated every death in Game of…
-
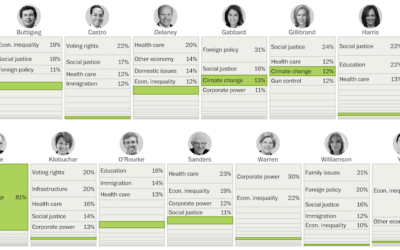
Issues Democratic hopefuls are talking about on social media
For the Washington Post, Kevin Schaul and Kevin Uhrmacher parsed the social media…
-

Bad data from a faulty sensor on the Boeing 737 Max
The New York Times illustrated what likely happened in the Ethiopian Airlines and…
-
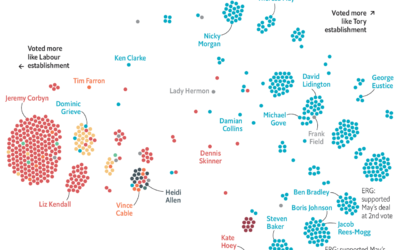
Brexit voting divisions
The Economist charted the divisions within political parties using Brexit votes as proxy.…
Recently for Members
Second Edition
 Visualize This: The FlowingData Guide to Design, Visualization, and Statistics (2nd Edition)
 Visualize This: The FlowingData Guide to Design, Visualization, and Statistics (2nd Edition)
New tools, refined process.
Browse by Chart Type See All →


