Neal Agarwal used a money printing metaphor to depict differences in various wages.…
Infographics
Telling stories with data and graphics.
-
Printing money at the speed of various wages
-
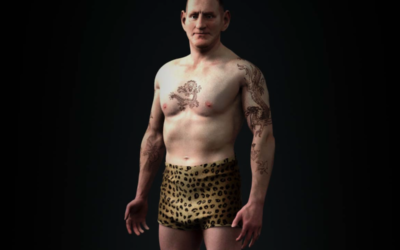
A tour of the king’s tattoos
DR used a 3-D model to recreate King Frederick the 9th’s ink:
King… -
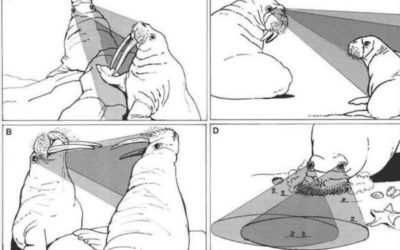
Questionable science diagrams
Sometimes illustrating scientific findings is a challenge. Sometimes the illustrations are published anyways,…
-
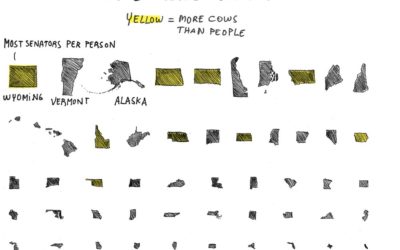
Cow representation in the Senate
For the Absurd America section of The Washington Post, Sergio Peçanha asks the…
-
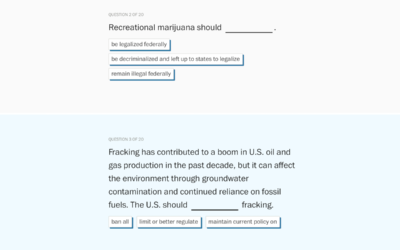
Quiz to see which Democratic candidate agrees with you most
The Washington Post asked Democratic candidates a series of policy questions. To see…
-
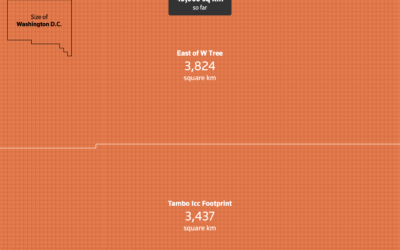
Scale of Australia bushfires shown with unit charts
Outside of Australia, it can be a challenge to get a grasp of…
-
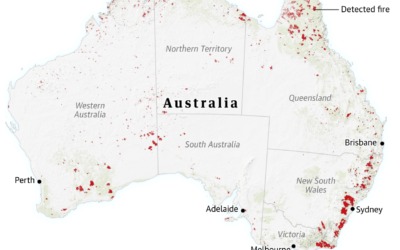
Visual guide for the fires in Australia
For The Guardian, Niko Kommenda and Josh Holder provide a visual guide to…
-
Weight gain lines
From Kim Warp for The New Yorker. Ha. Ha. It’s funny because it’s…
-
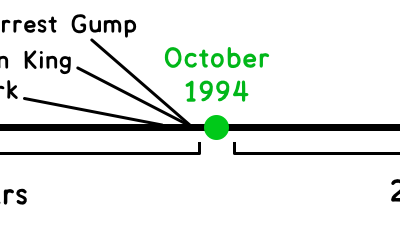
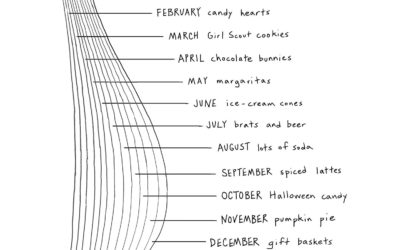
Timelines to make you feel old
One of the best ways to feel old is to look to your…
-
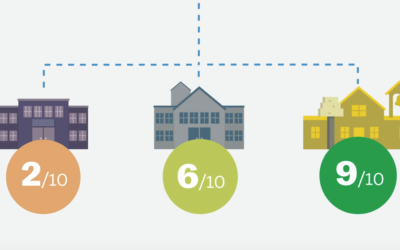
How online school ratings are flawed
Standardized ratings are a challenge, because they often try to encapsulate many variables…
-
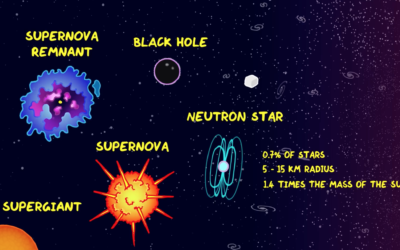
Everything in the universe
In this video, Dominic Walliman attempts to illustrate and explain all of the…
-
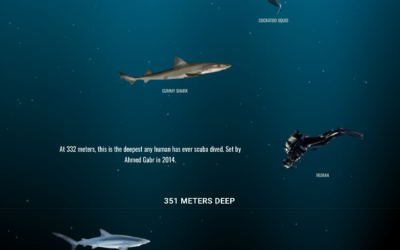
Scroll, scroll, scroll through the depths of the ocean
The oceans are deep. But how deep and what’s down there? Neal Agarwal…
-
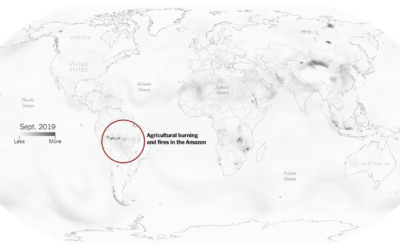
Compare your city’s air pollution to the rest of the world
High air pollution can lead to serious health risks, but you can’t usually…
-
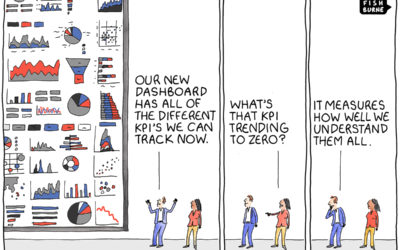
KPI overload
From Tom Fishburne, the Marketoonist. Maybe a dashboard isn’t the answer you’re looking…
-
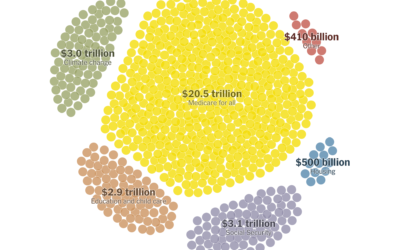
Paying for Elizabeth Warren’s proposed policies
Elizabeth Warren has big plans, and they would cost a lot with a…
-
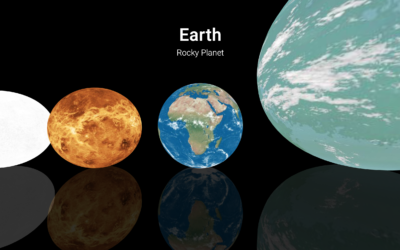
Scale of space browser
I always enjoy me some scale of space graphics. Neal Agarwal made an…
-

Visualizing the Friends sitcom
Marion Rouayroux, a graphic designer and a big fan of the show Friends,…
-
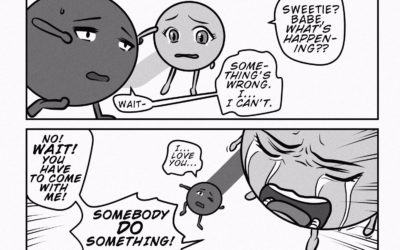
Diverging line plot as the perfect comic
This is perfect. Willikin Wolf made characters out of two dots moving along…
Recently for Members
Second Edition
 Visualize This: The FlowingData Guide to Design, Visualization, and Statistics (2nd Edition)
 Visualize This: The FlowingData Guide to Design, Visualization, and Statistics (2nd Edition)
New tools, refined process.
Browse by Chart Type See All →


