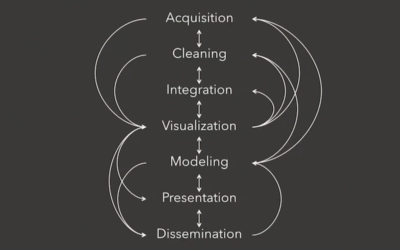
Jeffrey Heer, a computer science professor at the University of Washington, provides an…
Statistical Visualization
Finding patterns, distributions, and anomalies.
-
Constructing charts and graphs
-
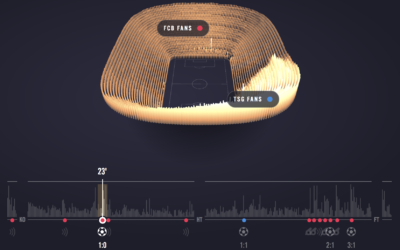
Experience a soccer game through crowd noise
Sports visualization and analysis tends to focus on gameplay — where the players…
-
More wildfires than ever
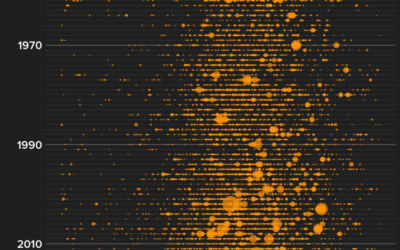
Peter Aldhous for BuzzFeed News delves into the increasing number of wildfires in…
-
Why the city is hotter than the suburb
NPR used video from a thermographic camera to explain why cities tend to…
-
Twitter bot purge
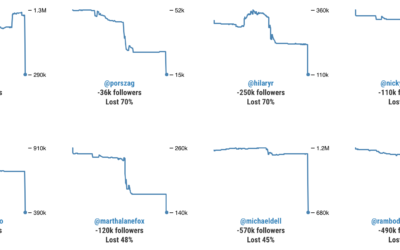
With Twitter cracking down, some users are experiencing bigger dips in follower count…
-
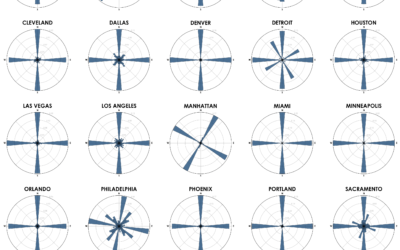
Street network orientation in major cities
Using OpenStreetMap data, Geoff Boeing charted the orientation distributions of major cities:
Each… -
Visual introduction to bias in machine learning
A few years ago, Stephanie Yee and Tony Chu explained the introductory facets…
-
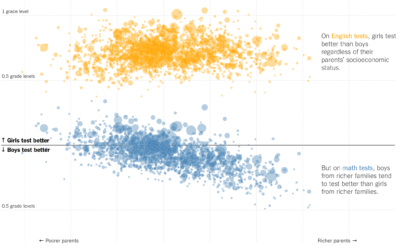
Math gender gap bigger in richer school districts
This is quite the scatterplot from Claire Cain Miller and Kevin Quealy for…
-
A visualization game to understand education and school segregation
Educate Your Child by Gabrielle LaMarr LeMee uses census data and the school…
-
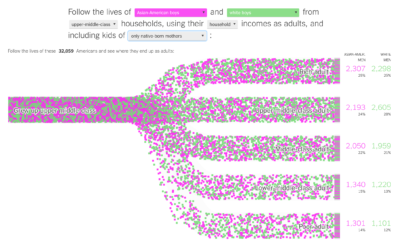
Income mobility for different groups
Building on their previous visualization work on black boys dropping income levels in…
-
Black boys dropping income levels as adults
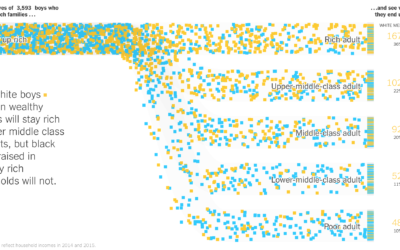
Research by Raj Chetty, Nathaniel Hendren, Maggie Jones, and Sonya Porter from the…
-
One-way tickets out for homeless people
Many cities provide free bus tickets for homeless people who want to relocate.…
-
Beginner’s guide to visualization literacy
Mikhail Popov, a data scientist at the Wikimedia Foundation, led a workshop on…
-
Who’s winning the medal race, depending on how you weight the medals
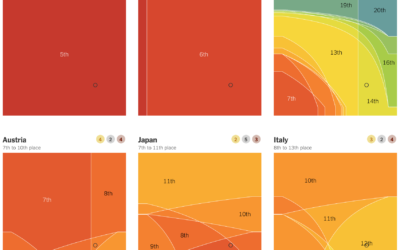
Every year, we look at the medal counts of each country. Who’s winning?…
-
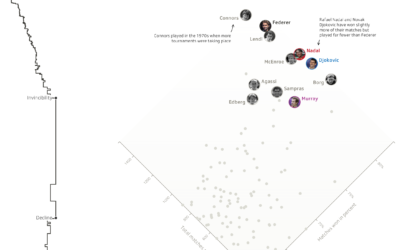
Roger Federer career in rankings and wins
Professional tennis player Roger Federer won his 20th Grand Slam title recently. He’s…
-
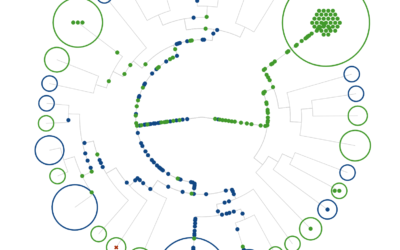
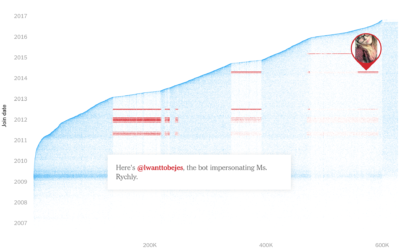
Finding fake followers
This fake follower piece by Nicholas Confessore, Gabriel J.X. Dance, Richard Harris, and…
-
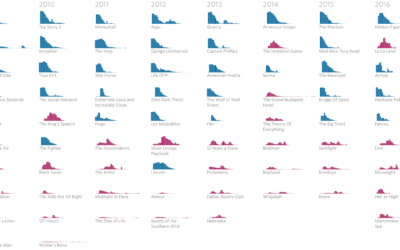
Release strategies for Oscar-nominated films
Evie Liu and William Davis, reporting MarketWatch, looked at release strategies of Oscar…
-
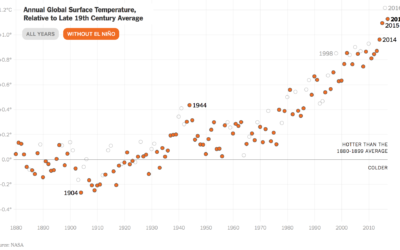
Surprise, the world was warmer again in 2017
According to NASA estimates, 2017 was the second warmest year on record since…



 Visualize This: The FlowingData Guide to Design, Visualization, and Statistics (2nd Edition)


