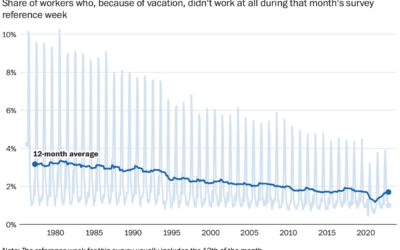
Despite available vacation days, it appears that American workers are taking less and…
Statistical Visualization
Finding patterns, distributions, and anomalies.
-
Declining vacation time from work
-
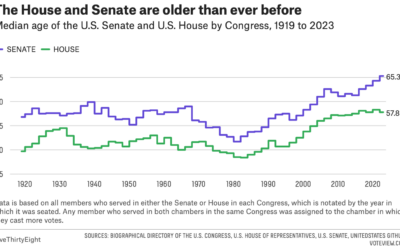
Congress still getting older
For FiveThirtyEight, Geoffrey Skelley digs into the ongoing trend:
What’s behind these increasingly… -
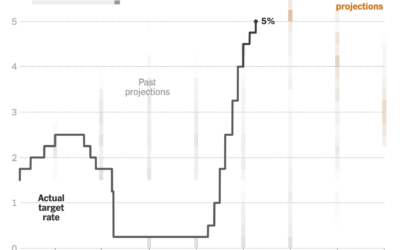
Changing Fed projections
This clever chart by Lazaro Gamio shows changing interest rates set by the…
-
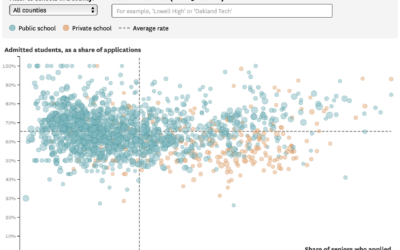
UC admission rates for California public and private high schools
For the San Francisco Chronicle, Nami Sumida shows admission rates at University of…
-
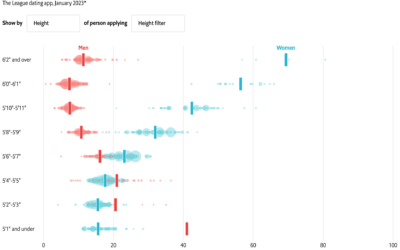
Online dating, who filters out what
With online dating apps, you’re able to filter out potential matches based on…
-
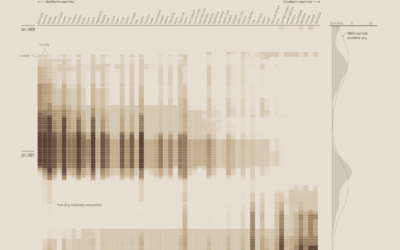
Past and present California drought severity
It’s been raining a lot here in California, which is helpful, because most…
-
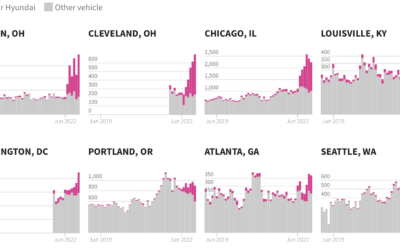
Excess Kia and Hyundai car thefts
In the middle of 2022, a popular video on TikTok, since taken down,…
-
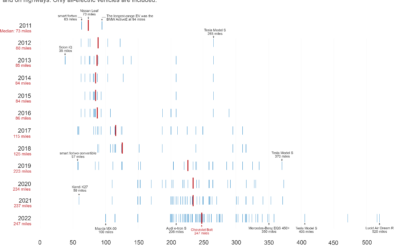
Increasing range of electric vehicles
Hannah Ritchie compared electric vehicle range over the years:
The median range of… -
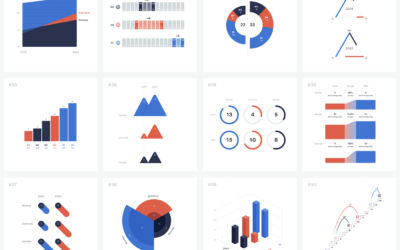
100 visualizations from a single dataset with 6 data points
The structure of a dataset can help you pick a visualization method or…
-
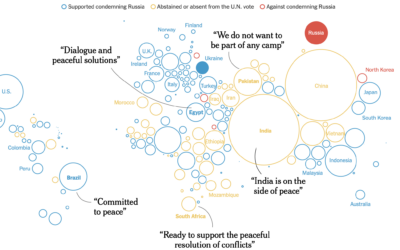
Trying to isolate Russia
The New York Times shows how the west tried to isolate Russia and…
-
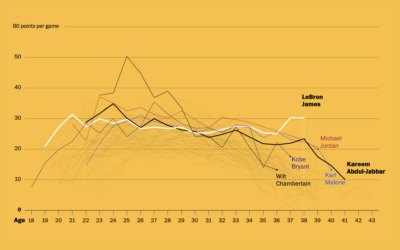
LeBron James’ longevity
Okay, one more LeBron James thing, mostly because I like seeing different looks…
-
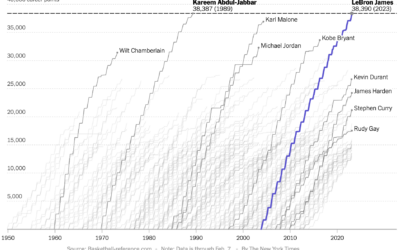
Cumulative points scored by LeBron James and other top scorers
Never fear, Sopan Deb, K.K. Rebecca Lai, and Eve Washington, for The New…
-
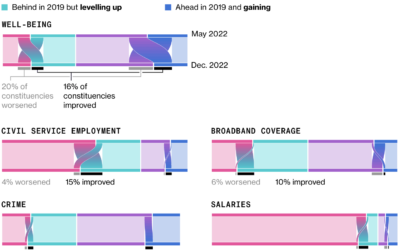
Sankey diagrams to show change in opinion
For Bloomberg, Joe Mayes, Andre Tartar, and Demetrios Pogkas show shifts in public…
-
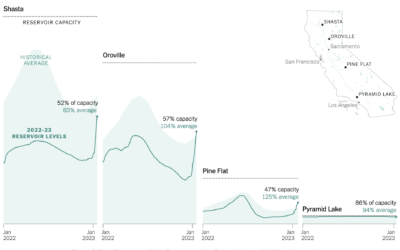
Reservoir refills in California
There’s been a lot of rain in California, which has been good to…
-
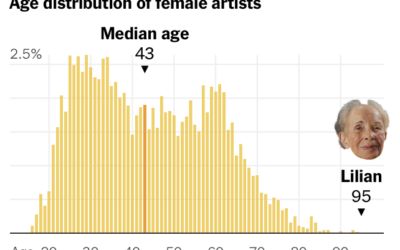
Tom Brady of other jobs
Tom Brady, the quarterback for the Tampa Bay Buccaneers, is 45 years old,…
-
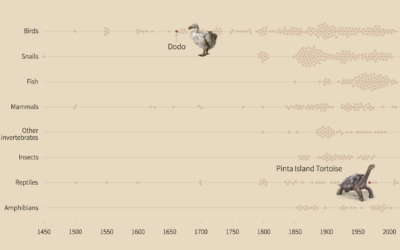
Animal extinction over time
Animals are going extinct at a faster rate. Reuters shows a developing pattern…
-
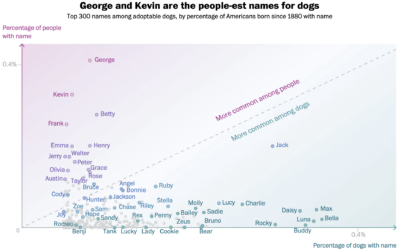
Names that are more dog or more human
There appears to be a trend of using human names for pets. Alyssa…
-
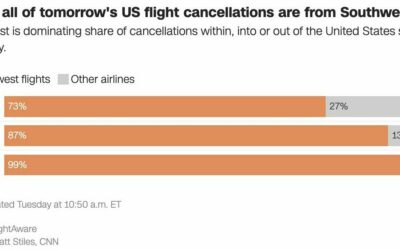
Southwest flight cancellations
There were a lot of flight cancellations this week, but Southwest Airlines is…

 Visualize This: The FlowingData Guide to Design, Visualization, and Statistics (2nd Edition)


