I know you don’t get enough election coverage these days and are probably…
Software
Programs and online applications to help you make use of data.
-
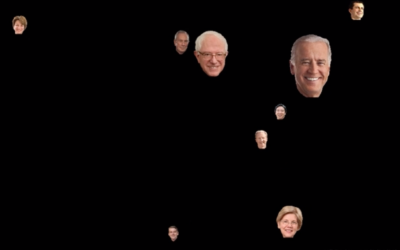
Presidential Hopefuls screensaver bounces heads around based on polling data
-
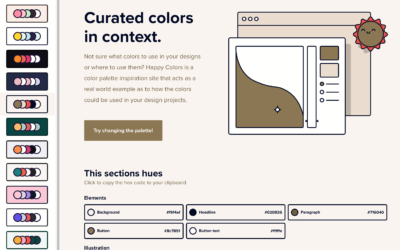
Color palettes browsable in context
Color scheme selections are nice and all, but they’re even better when viewed…
-
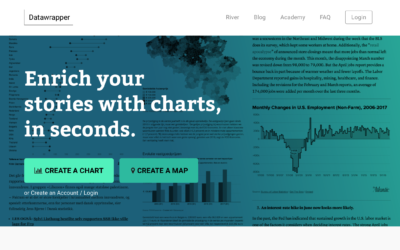
Datawrapper updates pricing structure, do more for free
Datawrapper, a focused web tool that makes online charts easier to put together…
-
Teaching R to 7th graders
Joshua Rosenberg describes his one-day experience teaching R to 7th graders:
[T]he activity… -
xkcd-style charts in JavaScript
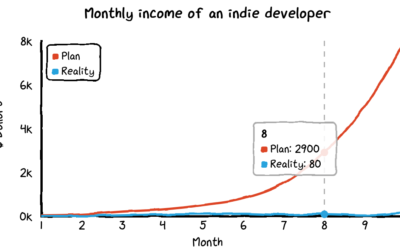
For xkcd fans, here’s a JavaScript library by Tim Qian that lets you…
-
Cleaning your data with Excel and Google Spreadsheets
For Datawrapper, Lisa Charlotte Rost outlines the steps to prepare and clean your…
-
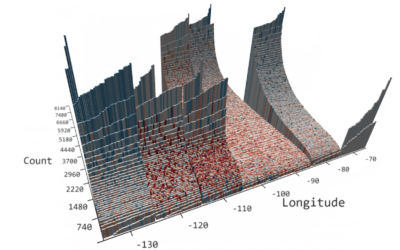
Microsoft’s visual data explorer SandDance open sourced
Microsoft just open sourced their data exploration tool known as SandDance:
For those… -
Animating a lot of dots with WebGL and REGL.js
A couple of weeks ago, The Washington Post visualized 13,000 school districts using…
-
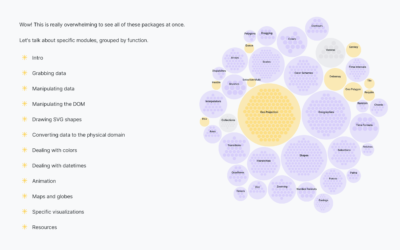
Bird’s-eye view of D3.js
D3.js can do a lot of things, which provides valuable flexibility to construct…
-
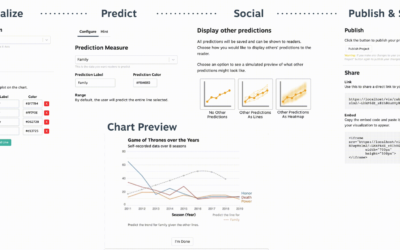
Make charts that ask readers to predict the line
A few years ago, The New York Times asked readers to guess a…
-
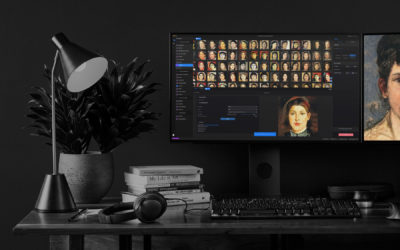
Runway ML makes machine learning easier to use for creators
Machine learning can feel like a foreign concept only useful to those with…
-
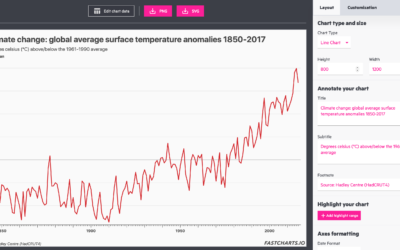
FastCharts to make charts fast
FastCharts is the public version of the Financial Times’ in-house solution for making…
-
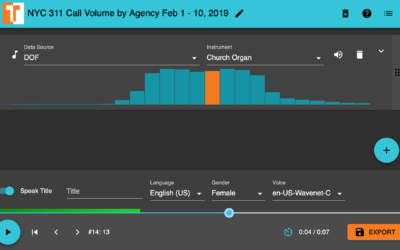
TwoTone is a tool to sonify your data
TwoTone, by Datavized and supported by the Google News Initiative, is a straightforward…
-
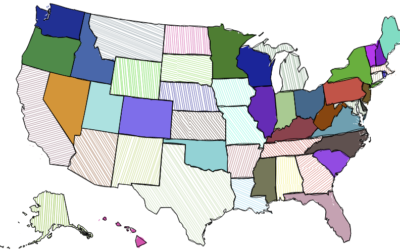
Hatching image effect in R
Here’s a fun thing to try in R. Jean Fan posted some code…
-
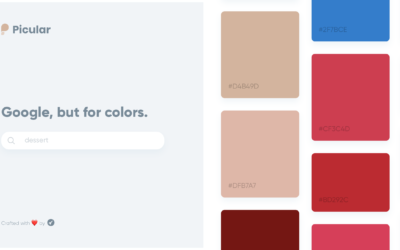
A search engine for color palettes
Picular is a simple tool that lets you search for a topic, and…
-
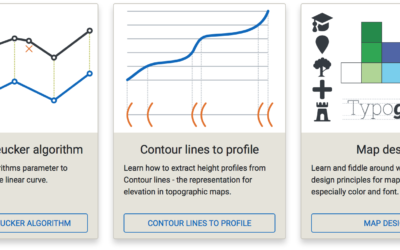
Cartography Playground
Map-making is a tricky business with many variables to consider that can directly…
-
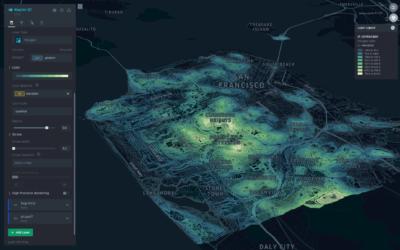
Kepler.gl, an open source tool for mapping large-scale spatial data
Kepler.gl, a collaboration between Uber and Mapbox, allows for easier mapping of large-scale…
-
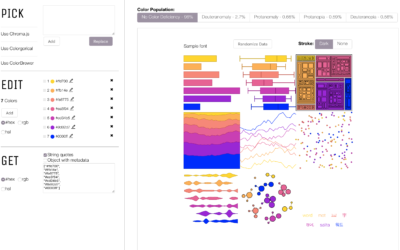
Visualization color picker, based on perception research
The colors you choose to visualize data can completely shift what you convey…
-
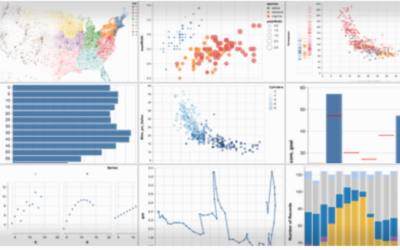
Altair for visualization in Python
Vega-Lite is a grammar for interactive graphics primarily used for analysis. Altair is…
-
Link
Rough.js →
Create graphics with a hand-drawn, sketchy, appearance.



 Visualize This: The FlowingData Guide to Design, Visualization, and Statistics (2nd Edition)


