Picular is a simple tool that lets you search for a topic, and…
Software
Programs and online applications to help you make use of data.
-
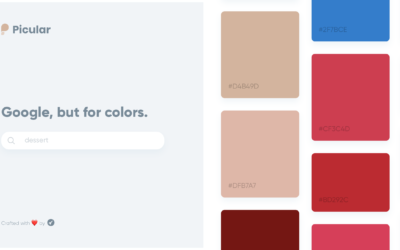
A search engine for color palettes
-
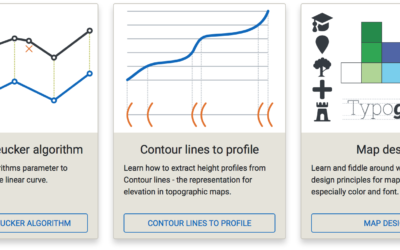
Cartography Playground
Map-making is a tricky business with many variables to consider that can directly…
-
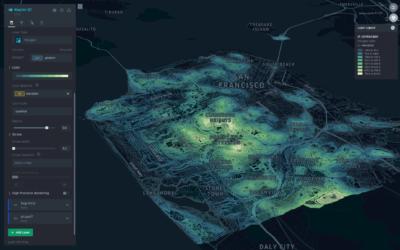
Kepler.gl, an open source tool for mapping large-scale spatial data
Kepler.gl, a collaboration between Uber and Mapbox, allows for easier mapping of large-scale…
-
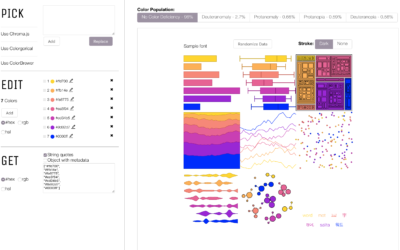
Visualization color picker, based on perception research
The colors you choose to visualize data can completely shift what you convey…
-
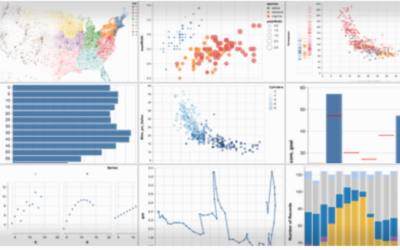
Altair for visualization in Python
Vega-Lite is a grammar for interactive graphics primarily used for analysis. Altair is…
-
Link
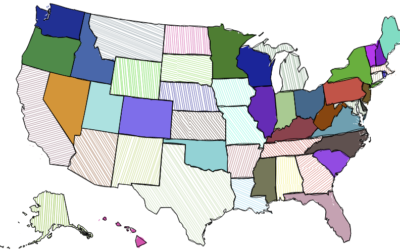
Rough.js →
Create graphics with a hand-drawn, sketchy, appearance.
-
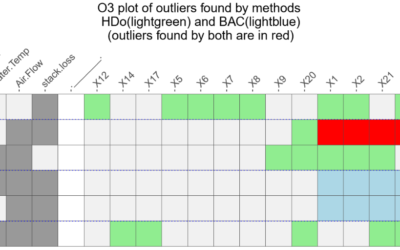
Outlier detection in R
Speaking of outliers, it’s not always obvious when and why a data point…
-

Field Guide to the R Ecosystem
If you’re looking to acquaint yourself with R — the non-coding aspects of…
-
Link
Automatic label placement along path →
Noah Veltman refined his label placement method, particularly useful for area graphs.
-
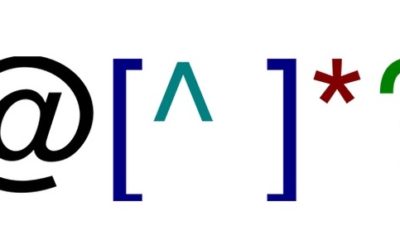
Introduction to regular expressions
If you want to analyze bodies of text, it’s a good to know…
-
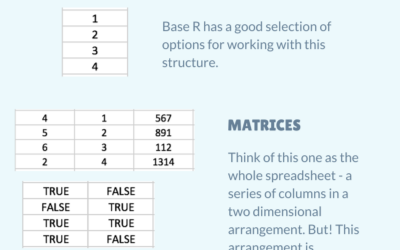
R data structures for Excel users
Introducing yourself to R as an Excel user can be tricky, especially when…
-

Microsoft Excel painter
Remember the artist Tatsuo Horiuchi who uses Microsoft Excel to paint scenery? Four…
-
Drawing with noise
This looks like a fun Processing tutorial by Etienne Jacob. Use noise to…
-

Scrollama.js, a JavaScript library for scrollytelling
Russell Goldenberg released Scrollama.js in an effort to make scrollytelling more straightforward to…
-
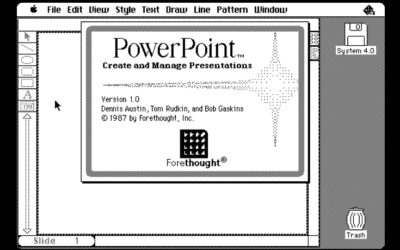
PowerPoint history lesson
David C. Brock writing for IEEE Spectrum delves into the origins of PowerPoint.…
-
Link
World Tile Grid Map in ggplot2 →
A straightforward tutorial on using squares instead of geographic boundaries.
-
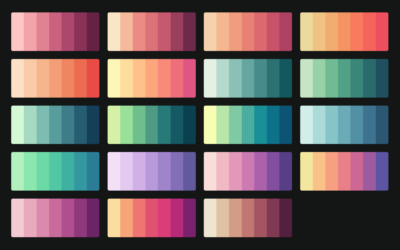
CARTOColors is a quick set of color schemes to copy
Picking colors is one my favorite things to do with visualization when I’m…
-
Link
R or Python? →
Big community and lots of tools for both.
-
Semiotic, a visualization framework
Elijah Meeks released Semiotic into the wild. It’s a framework that allows quick…
-
Link
d3-annotation 2.0 →
Next iteration of library for annotation. Made me delve into d3.js v4.
Recently for Members
Second Edition
 Visualize This: The FlowingData Guide to Design, Visualization, and Statistics (2nd Edition)
 Visualize This: The FlowingData Guide to Design, Visualization, and Statistics (2nd Edition)
New tools, refined process.
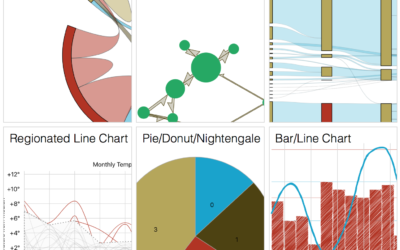
Browse by Chart Type See All →


