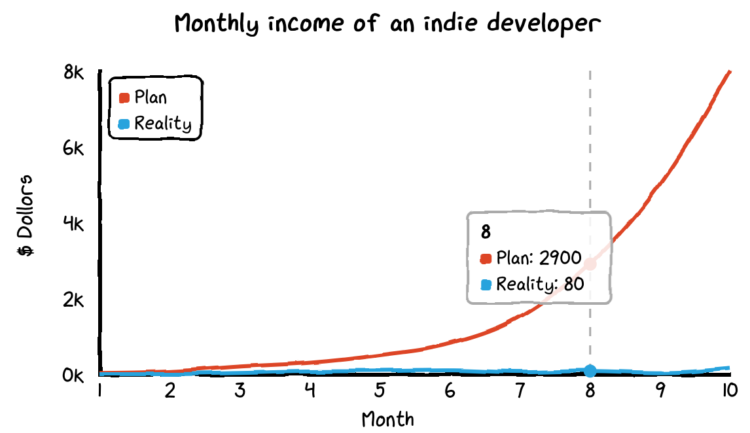
For xkcd fans, here’s a JavaScript library by Tim Qian that lets you style your charts like xkcd.
There’s something about sketchy, comic-style charts that makes the data feel more approachable. Maybe just because it’s different or looks more casual? I mean, I would use the style sparingly and maybe not in your next business meeting, but it’s kind of fun to mess with. You can also do this in R and Python of course.
 Visualize This: The FlowingData Guide to Design, Visualization, and Statistics (2nd Edition)