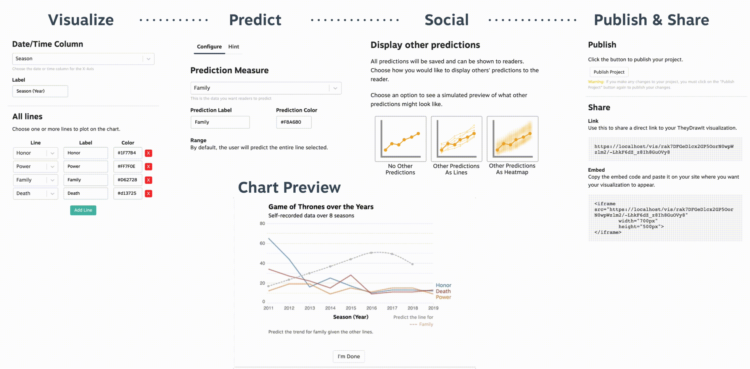
A few years ago, The New York Times asked readers to guess a trend line before showing the actual data. It forced readers to test their own beliefs against reality. TheyDrawIt from the MU Collective is a tool that lets you make similar prediction charts:
These line graphs encourage readers to reflect on their own beliefs by predicting the data before seeing it. Only after they draw a prediction does the real data appear. The graph can then show the reader traces of other peoples’ predictions. This progression makes it easy for readers to visualize the difference between their predicted beliefs, their peer’s beliefs, and the actual data.
 Visualize This: The FlowingData Guide to Design, Visualization, and Statistics (2nd Edition)