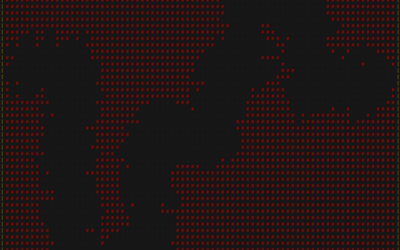
Matt Dray is developing a package in R that runs a text-based game.…
Software
Programs and online applications to help you make use of data.
-
Procedural dungeons in R
-
Agent-based modeling in JavaScript
Atomic Agents is a JavaScript library by Graham McNeill that can help simulate…
-
Ross Ihaka, co-creator of R, reflects on the language
NZ Herald talked to Ross Ihaka, one of the creators of R:
Today,… -
Seeing just the questions
As a way to explore how people use questions in their writing, a…
-
Colors for All, R package
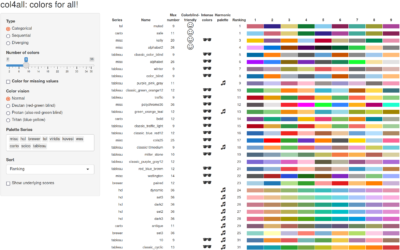
If you use color as a visual encoding, you should make sure every…
-
Spike maps in R
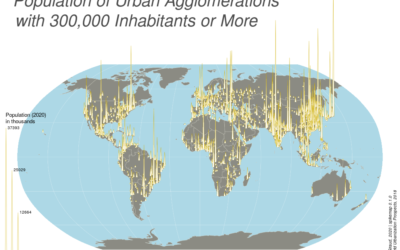
Spike maps use the height of spikes to encode data geographically. The format…
-
A Succinct Intro to R
Before you get into analysis and visualizing data with R, you need to…
-
SVG pattern repository
For when you want to fill SVG polygons with patterns instead of or…
-
Generative art with R
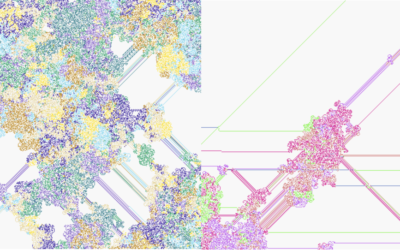
Generative art seems to be having a moment right now, so it’s only…
-
Weather Strip, an app that shows the forecast as a time series
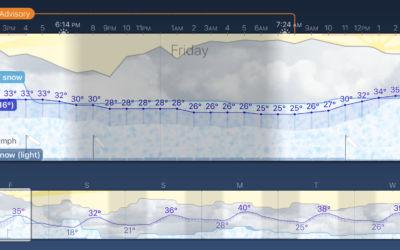
Weather Strip is a new weather app by visualization researcher Robin Stewart. It…
-
Value of R, the Statistics-specific language
Paul Ford has been learning R to better understand the field of Statistics.…
-
Find a color palette based on words
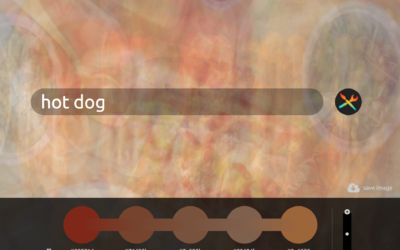
PhotoChrome is a straightforward tool that lets you use search terms to find…
-
Spatula, a Python library for maintainable web scraping
This looks promising:
While it is often easy, and tempting, to write a… -
Observable Plot, a JavaScript library for more straightforward visualization of tabular data
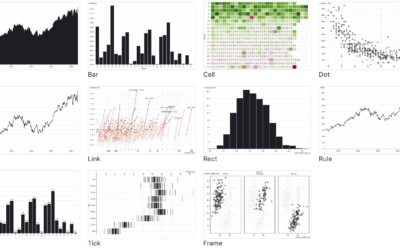
If you’re into the notebook workflow, Observable Plot is a JavaScript library built…
-
Using noise in creative coding
Oftentimes visuals generated through code can seem cold and mechanical when you’re after…
-
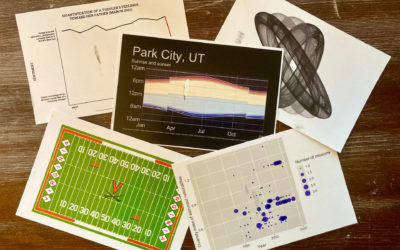
Send postcards of plots made in R
How many times have you made a plot in R and thought, “I…
-
Guide for React with D3.js
Amelia Wattenberger wrote a guide on how you can use the JavaScript library…
-
Code (data) as therapy
For Wired, Craig Mod writes about how he uses code as a way…
-
RAWGraphs 2.0, an open-source tool to visualize data
RAWGraphs, a tool conceived by DensityDesign in 2013, got a 2.0 update in…
-
Sim Daltonism, an intuitive app that simulates color blindness
When we visualize data to communicate to others, we must consider what others…





 Visualize This: The FlowingData Guide to Design, Visualization, and Statistics (2nd Edition)


