A more readable alternative to Venn diagrams for when you have more than a few sets.
ggplot2
-
Members Only
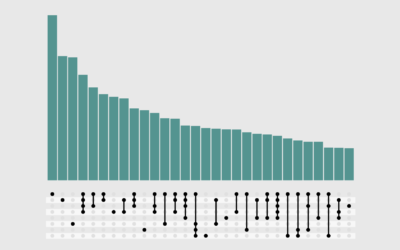
How to Make UpSet Plots in R, with ggplot2 and ggupset
-
Members Only
How to Make Print-ready Graphics in R, with ggplot2
You don’t have to use illustration software to polish your graphics. If keeping everything in R is your thing, this tutorial is for you.
-
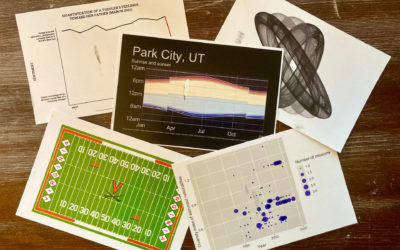
Send postcards of plots made in R
How many times have you made a plot in R and thought, “I…
-
Members Only
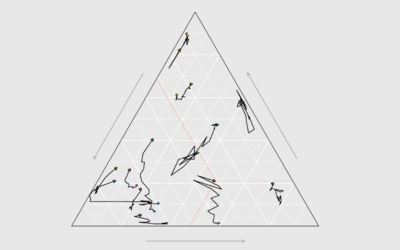
How to Make Ternary Plots in R, with ggplot2
When you want to compare between three parts of your data, ternary plots might be a good option. Here is how to make them.
-
Introducing a New Course on Mapping Geographic Data in R, with ggplot2
I’m happy to announce a new course on mapping geographic data in R,…
-
Members Only
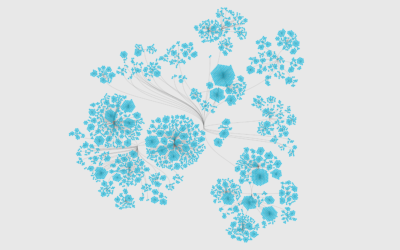
How to Visualize Hierarchical Graphs in R, with ggraph and tidygraph
Network graphs are a good way to find structure and relationships within hierarchical data. Here are several ways to do it.
-
Link
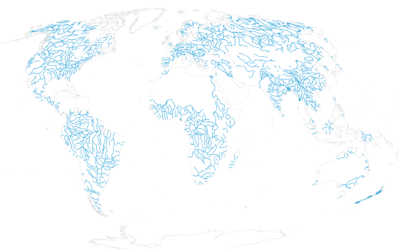
World Tile Grid Map in ggplot2 →
A straightforward tutorial on using squares instead of geographic boundaries.
-
Comparing ggplot2 and R Base Graphics
Figure out which is best with a side-by-side comparison.
Recently for Members
Second Edition
 Visualize This: The FlowingData Guide to Design, Visualization, and Statistics (2nd Edition)
 Visualize This: The FlowingData Guide to Design, Visualization, and Statistics (2nd Edition)
New tools, refined process.
Browse by Chart Type See All →


