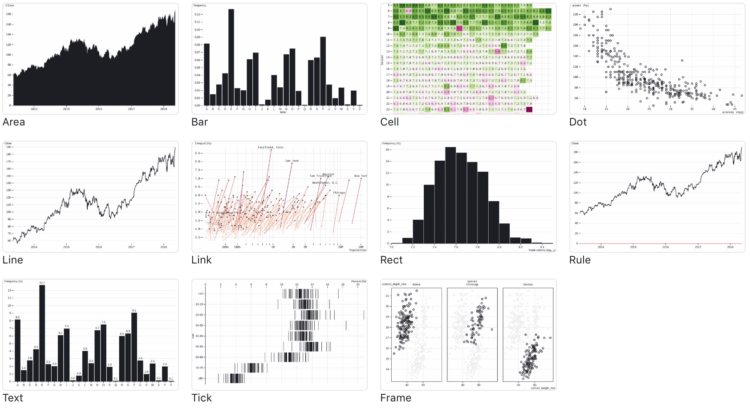
If you’re into the notebook workflow, Observable Plot is a JavaScript library built for you:
We created Plot to better support exploratory data analysis in reactive, JavaScript notebooks like Observable. We continue to support D3 for bespoke explanatory visualization and recommend Vega-Lite for imperative, polyglot environments such as Jupyter. Plot lets you see your ideas quickly, supports interaction with minimal fuss, is flexible with respect to data, and can be readily extended by the community. We believe people will be more successful finding and sharing insight if there’s less wrestling with the intricacies of programming and more “using vision to think.”
In case you’re curious how Plot compares to D3, which was used to build Plot, you can find that information here.


 Visualize This: The FlowingData Guide to Design, Visualization, and Statistics (2nd Edition)
