For ProPublica, Al Shaw, Irena Hwang, and Caroline Chen explain the increased risk…
Nathan Yau
-
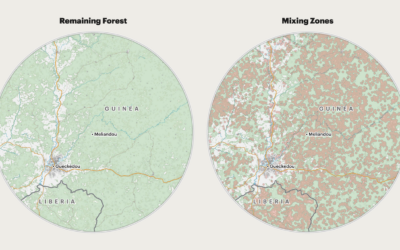
Deforestation and increased risk of outbreaks
-
Members Only

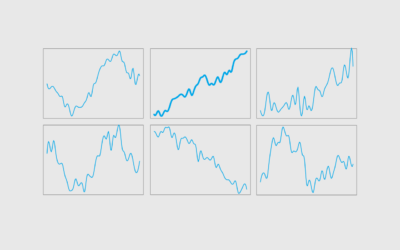
Narrow Audience
With fewer people in mind, you can visualize data with fewer trade-offs and greater focus.
-
Single Parents
In the 1950s, less than 10% of families with children were single-parent. In 2022, among families with children, 31% were single-parent — more than three times as common.
-

Fake sugars in your food
For The Washington Post, Anahad O’Connor, Aaron Steckelberg, and Laura Reiley visually describe…
-
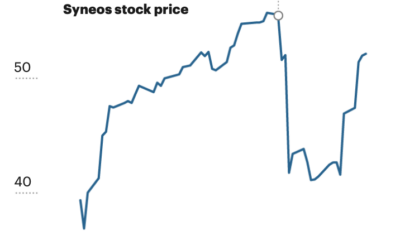
Curiously timed stock trades by ultra-wealthy
Continuing an analysis of IRS records, Robert Faturechi and Ellis Simani for ProPublica…
-
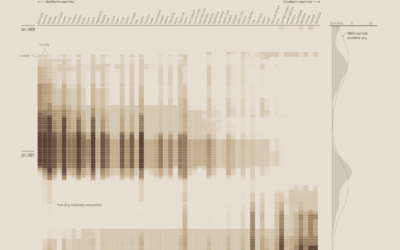
Past and present California drought severity
It’s been raining a lot here in California, which is helpful, because most…
-
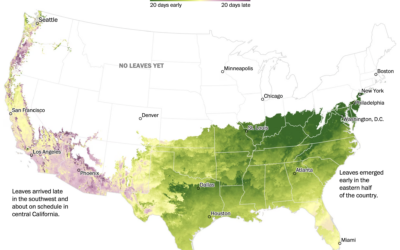
When spring is coming where you live
Going off the calendar, today is the first day of spring, but nature…
-
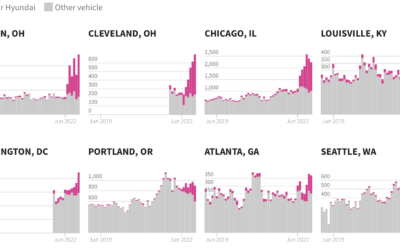
Excess Kia and Hyundai car thefts
In the middle of 2022, a popular video on TikTok, since taken down,…
-
Members Only
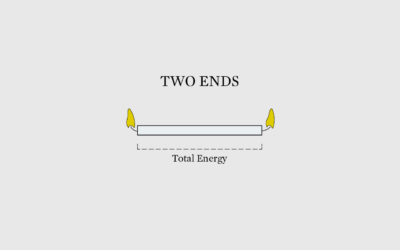
Burning Out
Energy is finite. So is time.
-
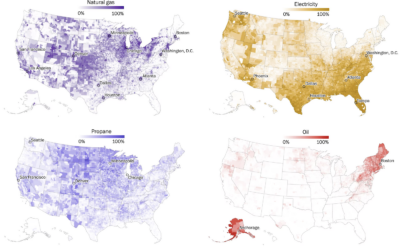
Maps of home heating sources in the United States
For The Washington Post, John Muyskens, Shannon Osaka, and Naema Ahmed mapped the…
-
More Dual Income, No Kids
People are waiting longer to have kids or not having kids at all, which leads to more dual income households with no kids.
-

Finding the physical location in an online video via Google Maps clues
GeoGuessr player rainbolt is next-level good at reading Google Maps. Given a short…
-

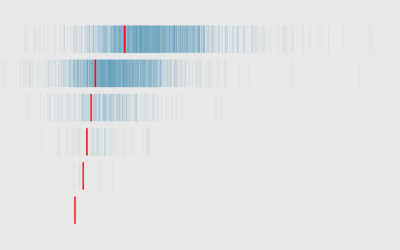
Bank Failures in the United States, Since 2001
These are all the failures since 2001, scaled by amount of assets in 2023 dollars.
-
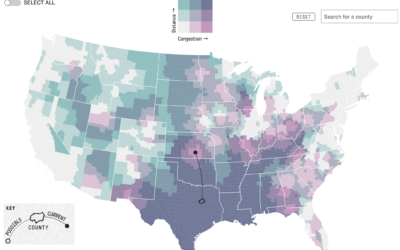
Hypothetical map that shows how access changes if more states ban abortion
Based on analysis by economics professor Caitlin Myers, FiveThirtyEight provides a hypothetical map…
-
NBA will track players with a third dimension
The NBA currently uses player-tracking that estimates player position on the court in…
-
Members Only

Making Old Charts Move
Same old chart, but make it move for another dimension.
-
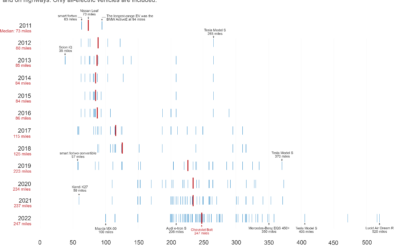
Increasing range of electric vehicles
Hannah Ritchie compared electric vehicle range over the years:
The median range of… -
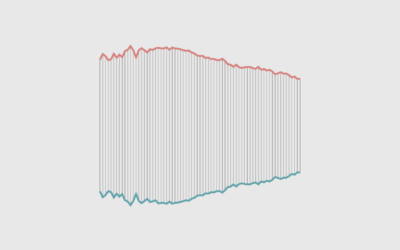
Multiple Income Households
Here’s household income by number of earners in the household, based on data from the 2022 Current Population Survey.
-
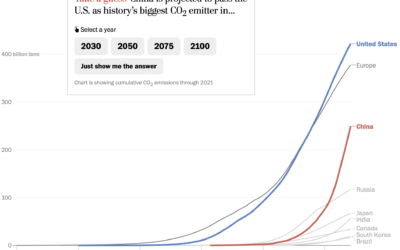
Line chart race to show emissions
For The Washington Post, Harry Stevens used the line chart equivalent of a…
-

Asian representation at the Oscars
Asian characters in American films are historically less integral to the stories and…
Recently for Members
Second Edition
 Visualize This: The FlowingData Guide to Design, Visualization, and Statistics (2nd Edition)
 Visualize This: The FlowingData Guide to Design, Visualization, and Statistics (2nd Edition)
New tools, refined process.
Browse by Chart Type See All →


