By keeping gas pipelines within the state, companies can avoid federal regulations. This…
Nathan Yau
-
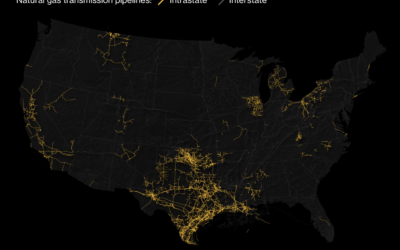
High concentration of intrastate pipelines in Texas
-
Young Money
We often associate high income with older people, but young people can also earn higher incomes. Let’s see what those people studied and what they do for a living.
-
Members Only
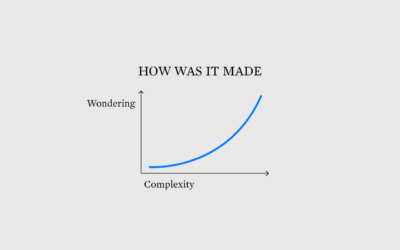
Figuring Out How a Visualization Was Made
One of the best ways to learn how to visualize data is to recreate a chart, but sometimes it’s unclear how that chart got made. What tool was used? What are the steps to make the chart with your own tools?
-
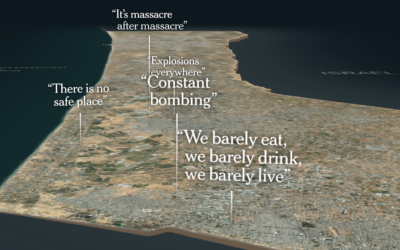
Life in the Gaza Strip
The New York Times put together an image of what life is like…
-
Steps for getting started with data visualization
Getting started with data visualization can be tricky because of all the resources…
-

A wide view of visualization with ‘The Art of Insight’
The Art of Insight, by Alberto Cairo, highlights how designers approach visualization with…
-
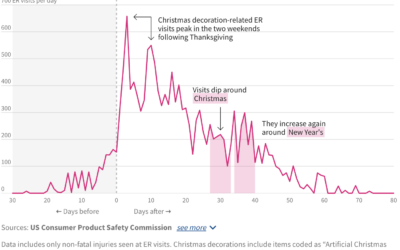
ER visits for Christmas decoration injuries
A lot of Christmas lights went up this past week. I hope you…
-
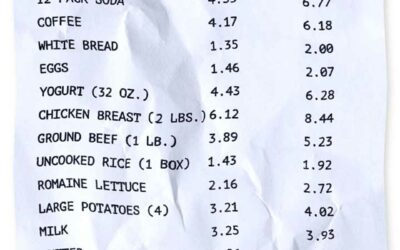
Inflation high, cost of living no good
Usually inflation is more of a slow thing that you don’t notice so…
-
Members Only

Visualization Tools, Resources, and Datasets – November 2023 Roundup
Here’s the good stuff for the month.
-
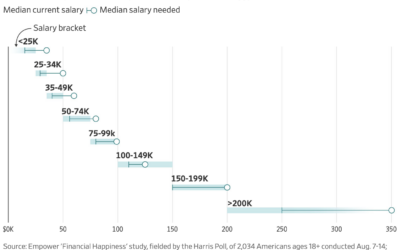
How much more income people need to be happy
For the Wall Street Journal, Joe Pinsker reports on income and happiness, or…
-
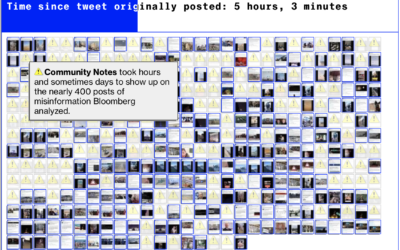
Failed community notes to stop misinformation on Twitter
Twitter has a Community Notes feature that attempts to flag posts that contain…
-
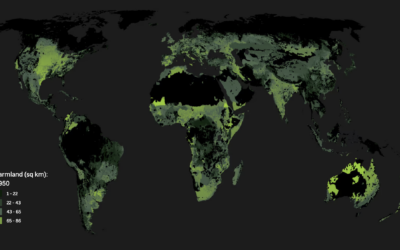
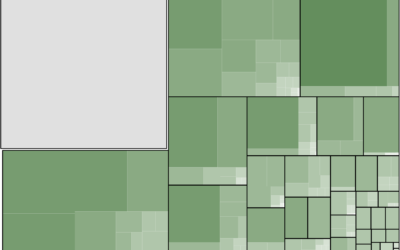
Running out of space to grow food
For Associated Press, Christina Larson and Nicky Forster examined the growing population and…
-
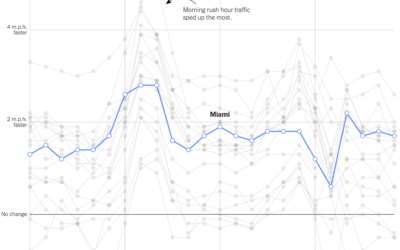
Change in commute times in major cities
Using GPS data processed by Replica, Lydia DePillis, Emma Goldberg, and Ella Koeze,…
-

Toddlers and stochastic parrots
For The New Yorker, Angie Wang draws parallels between toddler learning behavior and…
-
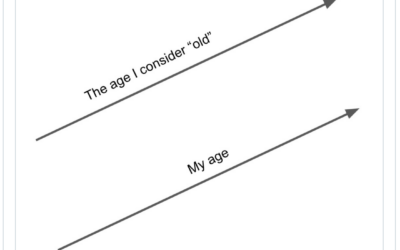
Parallel lines of old
This doesn’t have labeled axes, so I assume it only shows a zoomed…
-
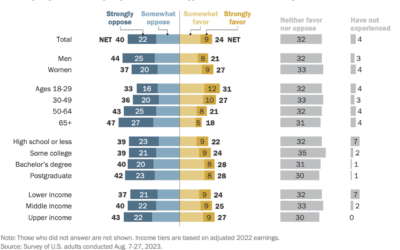
Attitudes towards tipping in the U.S.
Tipping seems to be in a confusing spot right now. On the one…
-
Jobs with Higher Income and Fewer Hours
So people earn a six-figure income without working all the time. What do they do?
-

Building fair algorithms
Emma Pierson and Kowe Kadoma, for Fred Hutchinson Cancer Center, have a short…
-
Members Only
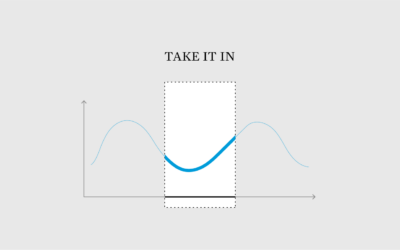
Chart Options When You Have Little Space
As more charts shift to smaller screens, we have to find ways to save space but keep the data readable. There are options.
-
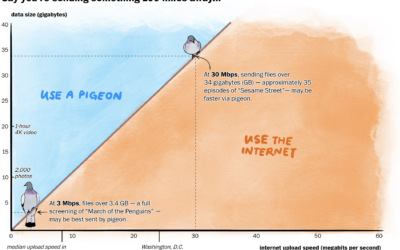
Carrier pigeon vs. internet upload speeds
In some rural areas, upload speeds are crawlingly slow, which can make it…
Recently for Members
Second Edition
 Visualize This: The FlowingData Guide to Design, Visualization, and Statistics (2nd Edition)
 Visualize This: The FlowingData Guide to Design, Visualization, and Statistics (2nd Edition)
New tools, refined process.
Browse by Chart Type See All →


