Martin Wattenberg, who with his associate Fernanda Viégas, was just snatched up by…
Nathan Yau
-

Martin Wattenberg talks data and visualization
-
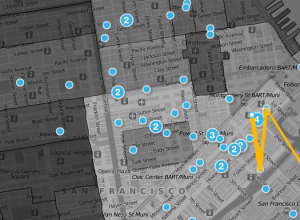
Weeplaces visualizes your FourSquare movements
I’m still not comfortable sharing my location with strangers, and my friends are…
-

Designing an easier-to-read NYC subway map
There’s a lot of history behind the New York City subway map, but…
-
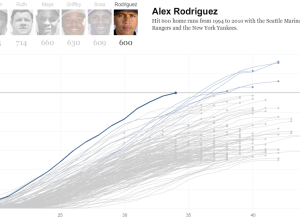
Alex Rodriguez joins the 600 club
Alex Rodriguez became only the seventh player in MLB history to hit 600…
-

$8.7b Iraq development funds unaccounted for
A simple question from GOOD magazine: where did the money to rebuild Iraq…
-
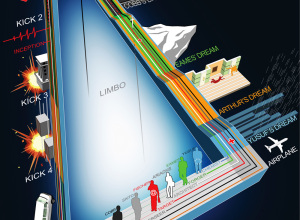
Another view of Inception, with the kicks this time
Here’s another timeline of Inception from deviantArt user, dehas. This one has the…
-
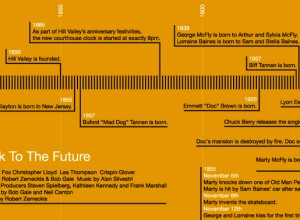
Back to the Future trilogy timelines
You know I can never resist a good Back to the Future reference.…
-
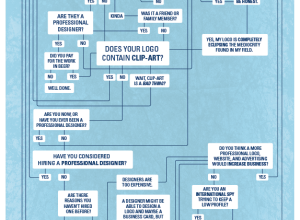
Need a new logo? Use this flowchart to decide
This flowchart from Watermark Design helps you decide if you need a new…
-
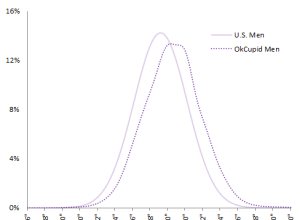
Lies people tell in online dating
Online dating site OkCupid continues with amusing yet thorough analysis of their 1.51…
-

New York Times on how they design their graphics
Leading up to their book, Turning Pages: Editorial Design for Print Media, publisher…
-
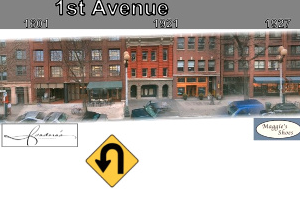
Browse street-side with Microsoft Street Slide
When street view came out on all the the popular online map applications,…
-
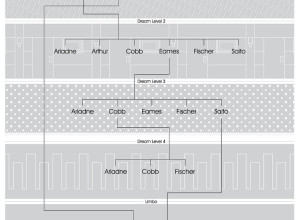
Inception dream levels explained in flowchart
You knew this was coming. I’d call spoiler alert for those who haven’t…
-
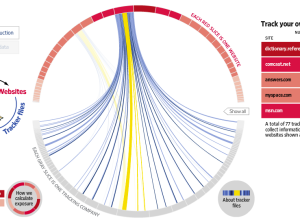
What online marketers know about you
Andrew Garcia Philips and Sarah Slobin (plus five data gatherers) of The Wall…
-
Exploring the Reach of Firefox
Once every blue moon I like to freelance as a short break from…
-
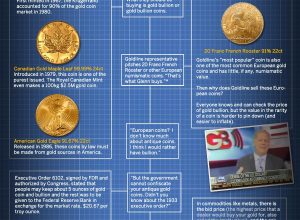
Inside the Glenn Beck/Goldline scheme
Jess Bachman and Barry Ritholtz take a look at the Glenn Beck/Goldline scheme…
-
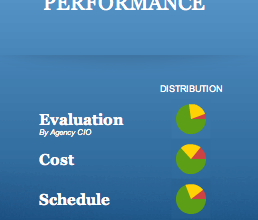
Redesign of the Federal IT Dashboard
About a year after the launch of the Federal IT Dashboard, business intelligence…
-
Best of FlowingData – July 2010
Thanks again, everyone for sharing FlowingData. It was another good month, and it…
-
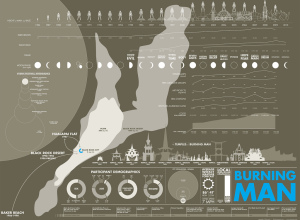
A graphical look at Burning Man
This graphic on Burning Man is totally lost on me, but maybe you…
-
FlowingData is brought to you by…
My thanks to the FlowingData sponsors. They keep the lights on and keep…
-
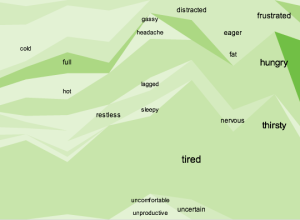
Discuss: Why collect data about yourself?
Personal data fascinates me. I collect data about myself mostly as a way…
Recently for Members
Second Edition
 Visualize This: The FlowingData Guide to Design, Visualization, and Statistics (2nd Edition)
 Visualize This: The FlowingData Guide to Design, Visualization, and Statistics (2nd Edition)
New tools, refined process.
Browse by Chart Type See All →


