Taking another step towards data transparency, the US government provides the IT dashboard via USAspending.gov:
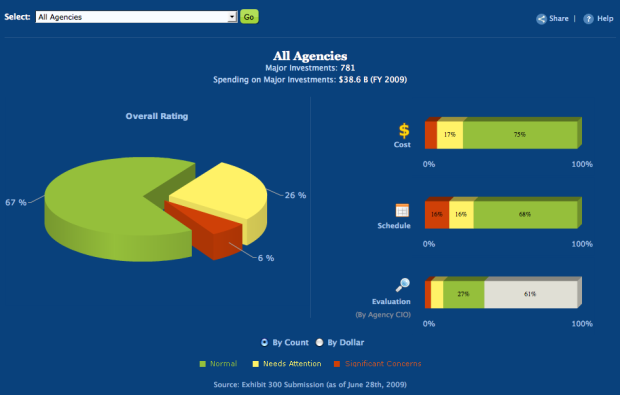
The IT Dashboard provides the public with an online window into the details of Federal information technology investments and provides users with the ability to track the progress of investments over time. The IT Dashboard displays data received from agency reports to the Office of Management and Budget (OMB), including general information on over 7,000 Federal IT investments and detailed data for nearly 800 of those investments that agencies classify as “major.” The performance data used to track the 800 major IT investments is based on milestone information displayed in agency reports to OMB called “Exhibit 300s.” Agency CIOs are responsible for evaluating and updating select data on a monthly basis, which is accomplished through interfaces provided on the website.
Along with a page to filter and download spending data, there’s a variety of views into the IT spending data that all provide a pretty good level of interaction.


One thing I can’t really figure out is if “IT investments” means investments in the traditional sense like stocks, or if it’s something else. I was a little surprised that the government is making investments at all but I guess I didn’t have any good reason to think that. I don’t know. Maybe someone can explain it to me.
[Thanks Justin & Preston]
 Visualize This: The FlowingData Guide to Design, Visualization, and Statistics (2nd Edition)
“IT investments” would most likely mean capital expenditure (capex) and operational expenditure (opex) required to run each department. For example specific items might include new servers and wages for desktop support staff.
Also, “I was a little surprised that the government is making investments at all”. The US Government has large investments in corporates at the moment, equity and warrant holdings in numerous financials. These holdings are historically unusual.
“IT Investments” indicates spend on IT project. These IT projects result in an IT asset that will repay itself over multiple years.
These project are comparable to buying and installing a production machine. Money spend on assets that repay themselves over multiple years is called investment.
Does anybody know whether they visualizations are implemented using some available Flash library?
Ofer,
The basic charts were done with Fusion Charts. The trends analysis charts use the Google Motion Charts. The investment treemap is from JuiceKit (www.juicekit.org).
A little added texture–as mentioned above, “investment” here is primarily capex with some opex thrown in; it’s generally a measure of IT spend per agency. The term “investment” was enshrined in the Clinger-Cohen Act, most likely to get away from an impression of big government spending.
The Exhibit 300B (from Clinger-Cohen) and reporting requirements in areas such as enterprise architecture, e-government, paperwork reduction/elimination, use of e-signatures, etc. produce a lot of data from each agency, most of which rolls up to OMB.
The IT Dashboard is a good way to communicate value to constituents while demonstrating to federal agencies why the data are required. There are bound to be errors and omissions, but this is a healthy step forward for the IT Capital Planning process.
Pies–usually not the best way to convey information
Exploding Pies–worse
All Pieces Exploding–worser
3D All Pieces Exploding–worserest
Blue text on blue background–bad
Tiny font with lots of empty space–badder
Legend in tiny font between other text not obviously related to chart it is describing–badderest
Pingback: IT Dashboard, los datos de las inversiones TIC del gobierno USA | Stralunato
Pingback: IT Dashboard of the US government « PierG (aka Piergiorgio Grossi)
Joseph,
Thanks for the info on the Clinger-Cohen Act origin of the term “investment” in this context – on first blush it does seem a slightly anachronistic use of the word!