This week is about highlighting changes in data visually to make them glaringly obvious.
Nathan Yau
-
Members Only
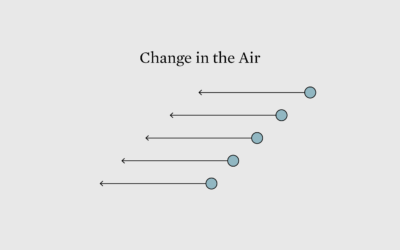
Visualizing Differences Between Two Points in Time
-
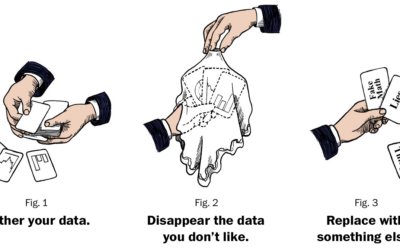
Instead of lying with data, just delete it altogether
Amanda Shendruk and Catherine Rampell, for Washington Post Opinion, highlight the current strategies…
-
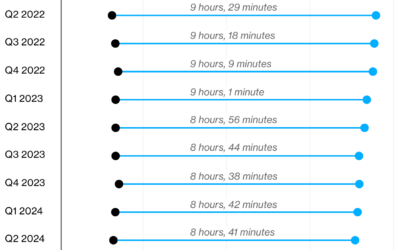
Clocking out of work earlier
According to data from ActivTrak, people are shortening their work days with higher…
-
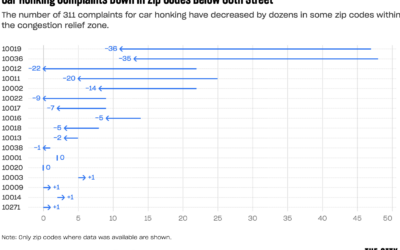
Fewer honking complaints after congestion pricing
This might come as a surprise to some, but since congestion pricing in…
-
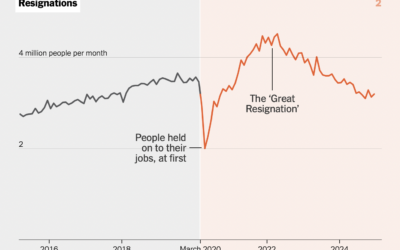
Everyday life changes after Covid
In almost every dataset about life and people that stretches back past March…
-
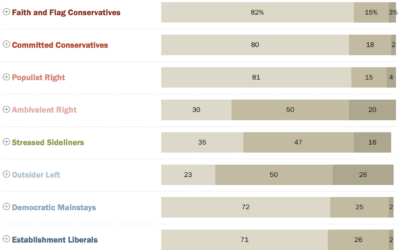
Political typology quiz
From Pew Research, this political typology quiz is from four years ago but…
-

Less sense of belonging, in middle school
Alvin Chang, for the Pudding, highlights education research on the awkwardness of middle…
-

Access FiveThirtyEight resources while they’re still around
Last week, Disney laid off FiveThirtyEight employees and announced the site would cease…
-
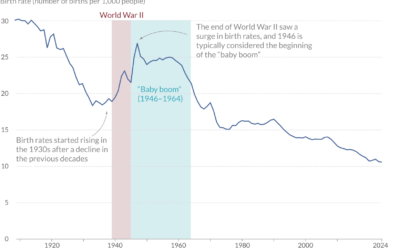
Charted history of the baby boom
For Our World in Data, Saloni Dattani and Lucas Rodés-Guirao analyzed the various…
-
Members Only
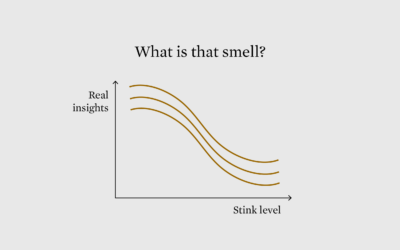
Smell Test for Data
The first part of visualizing data usefully is making sure the data you’re working with is not terrible.
-
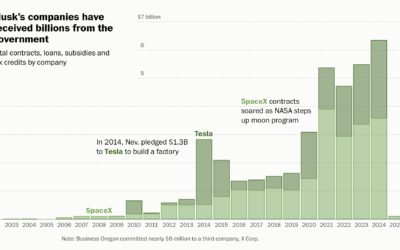
$38b of government money that funded Musk companies
Elon Musk has been critical of government spending, as he and DOGE fire…
-
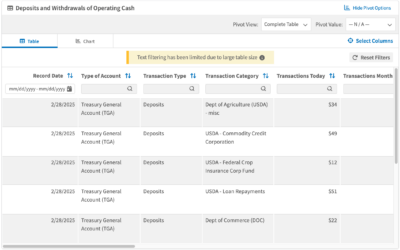
Frozen government money pipe
Planet Money explains the Daily Treasury Statement from the U.S. Treasury. The data…
-
Nate Silver on Disney’s 538
Nate Silver writes a few thoughts on the closing of FiveThirtyEight:
For more… -

FiveThirtyEight is shutting down completely
Disney is cutting news jobs, and FiveThirtyEight, which was absorbed by ABC News…
-
Creativity and optimization
For The New York Times, Siobhan Roberts talked to mathematician and Fields Medal…
-
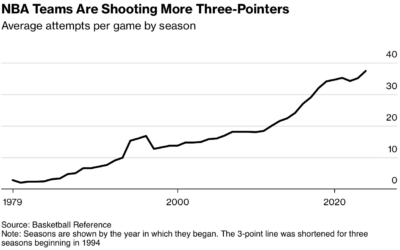
Optimizing basketball, too much
For Bloomberg, Ira Boudway reports on NBA basketball going too far with the…
-
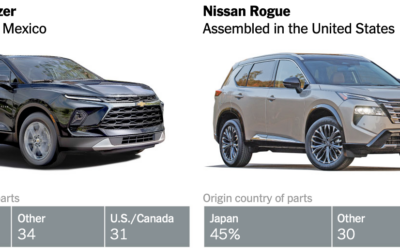
Ambiguity in what counts as American-made vehicles
Speaking of imported vehicle parts, June Kim and Neal Boudette, for The New…
-

Imported parts on a Chevrolet Silverado
To demonstrate how tariffs can impact American products, Financial Times focuses on the…
-
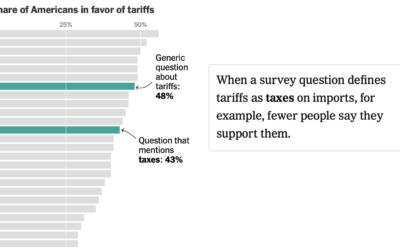
Survey answers and framing the question
When you see surveys that supposedly ask the same question, you might wonder…
-
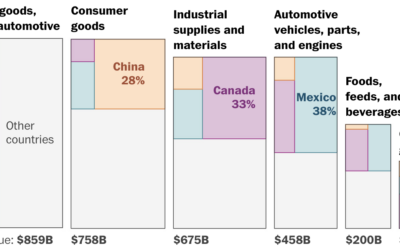
Products affected by tariffs in the U.S.
Luis Melgar and Rachel Lerman, for the Washington Post, highlight the value of…
Recently for Members
Second Edition
 Visualize This: The FlowingData Guide to Design, Visualization, and Statistics (2nd Edition)
 Visualize This: The FlowingData Guide to Design, Visualization, and Statistics (2nd Edition)
New tools, refined process.
Browse by Chart Type See All →


