Last year, ProPublica revealed that Facebook allowed housing advertisers to exclude races in…
Nathan Yau
-
Facebook still allowed race exclusion for housing advertisers
-
Google collected Android users’ location without permission
Keith Collins reporting for Quartz:
Since the beginning of 2017, Android phones have… -
Troubling pick for Census Bureau deputy director
The administration’s current pick for deputy director of the United States Census Bureau…
-
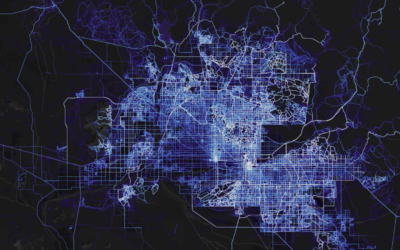
Global cycling and running heatmap
A few years back, cycling and running app Strava mapped the paths of…
-

Scrollama.js, a JavaScript library for scrollytelling
Russell Goldenberg released Scrollama.js in an effort to make scrollytelling more straightforward to…
-
Members Only
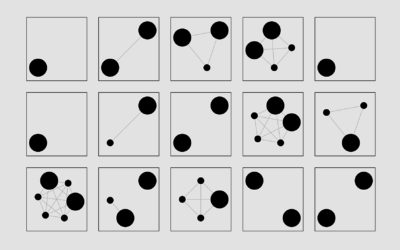
Getting Started with Network Graphs in R
Add the vertices. Connect them with edges. Repeat as necessary.
-
Link
What Questions to Ask When Creating Charts →
Make charts with a purpose.
-
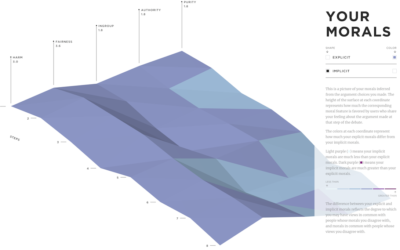
Based on your morals, a debate with a computer to expose you to other points of view
Collective Debate from the MIT Media Lab gauges your moral compass with a…
-

Switching Jobs
When people move to different jobs, here’s where they go.
-
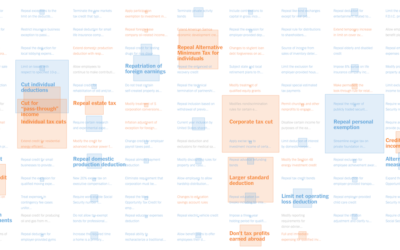
Every tax cut and increase in House Republicans’ bill
The House Republicans will vote on a tax bill soon that adds about…
-

How generative music works
Generative music comes from the design of a system that produces notes that…
-
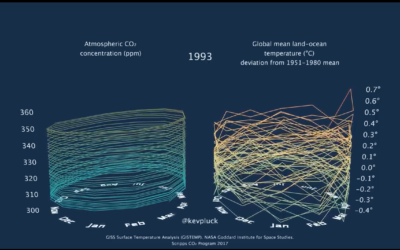
3-D tube chart of global CO2 concentration and temperature
Because you can never have enough time series charts that show increases of…
-

Looking for patterns and structures from the sky
Photographer Bernhard Lang takes pictures in small planes and helicopters, pointing his camera…
-
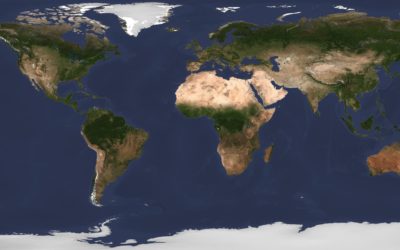
A daily high-resolution image of Earth
Planet monitors Earth with hundreds of satellites, and after six years, they’ve built…
-
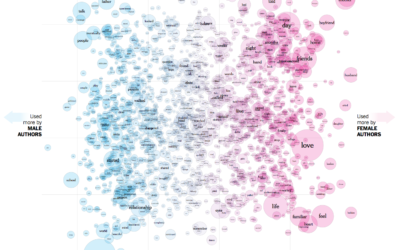
The words used by men and women to write about love
Josh Katz, Claire Cain Miller, and Kathleen A. Flynn for The Upshot plotted…
-
Importance of form and survey design to gain an accurate picture
Lena Groeger, writing for Source, shifts attention upstream from analysis to the design…
-
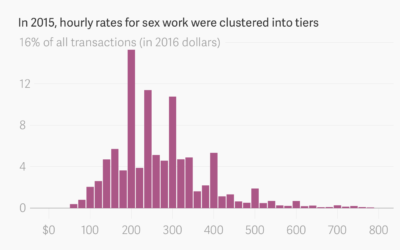
Changing internet markets for sex work
The internet changed how sex workers and clients find each other and how…
-
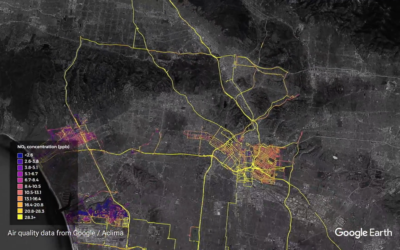
Google maps street-level air quality using Street View cars with sensors
Google equipped their Street View cars with air quality sensors and sent them…
-
Members Only

How to Make (and Animate) a Circular Time Series Plot in R
Also known as a polar plot, it is usually not the better option over a standard line chart, but in select cases the method can be useful to show cyclical patterns.
-
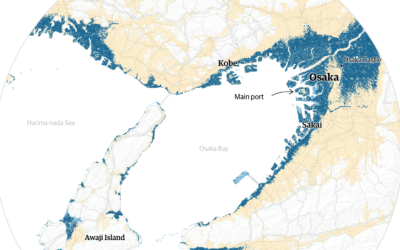
Cities projected to be under water by 2100
Using Climate Central sea-level rise estimates, The Guardian plots and maps the potential…
Recently for Members
Second Edition
 Visualize This: The FlowingData Guide to Design, Visualization, and Statistics (2nd Edition)
 Visualize This: The FlowingData Guide to Design, Visualization, and Statistics (2nd Edition)
New tools, refined process.
Browse by Chart Type See All →


