Unemployment in America, Mapped Over Time
We often hear about shifting unemployment rate at the national scale. It went up. It went down. It changes month-to-month. But unemployment is very regional, more common in some areas of the country than others. In many areas, unemployment rates remain relatively high despite the decreases in the national average.
The Bureau of Labor Statistics estimates county-level unemployment on a monthly basis. You can also get annual averages that go back to 1990. In the animated map above, I used the datasets to show the shifts over the past few decades.
Watch out for the big shift between 2008 and 2011 — and then the decrease in unemployment leading up to the present.
Of course, this rise and fall is obvious through the national average, shown in the chart below.
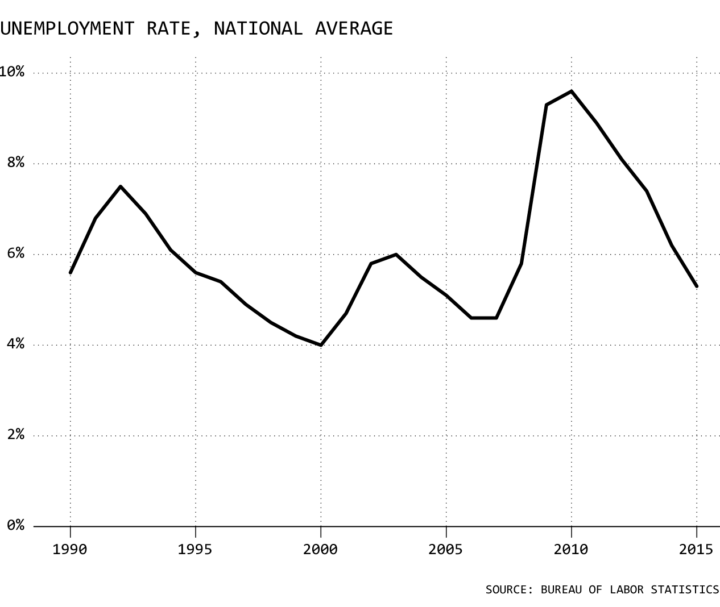
While the line chart is more succinct, the map shows more complexity and feels more real.
 Mapping Irregular Data with Interpolation in R
This is how to make this kind of map with your own data.
Nerd Notes
- This was largely an excuse to try out the steps that David Sparks outlined to make his election map. BLS provides county estimates, so I interpolate to fill in the gaps and use basic linear transitions between years. As with all smoothing, this method has its advantages and disadvantages.
- I made the bulk of this video in R.
Become a member. Support an independent site. Make great charts.
See What You GetFlowingData is made possible by supporting members. Since 2007, I, Nathan Yau, a real person, have been analyzing and visualizing data to help more people understand and appreciate it in their everyday lives.
If you liked this or want to make similar data things, please consider supporting this small corner of the internet. You get unlimited access to visualization courses, tutorials, and extra resources. Thanks. — Nathan