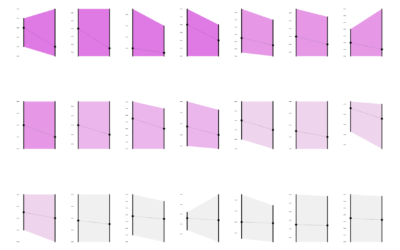
Generative art seems to be having a moment right now, so it’s only…
2021
-
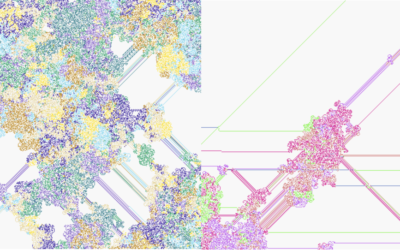
Generative art with R
-
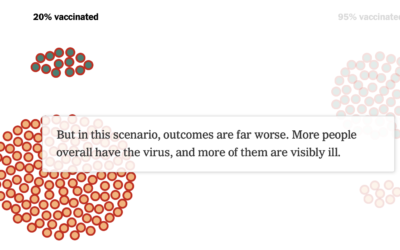
How vaccines can make a difference with the Delta variant
We see percentages for the vaccinated and unvaccinated, and people can easily misinterpret…
-
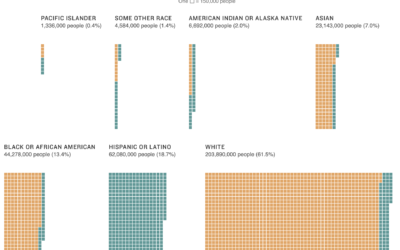
Multiracial people counted in the census
Using unit charts, NPR shows the number of people who identify with each…
-
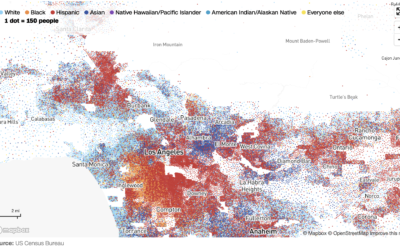
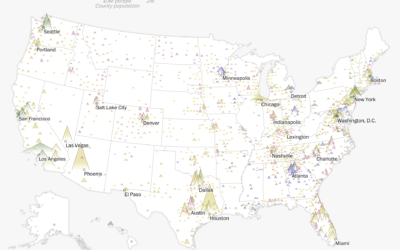
Race and ethnicity map of dots
CNN goes with the dot density map for their first pass on the…
-
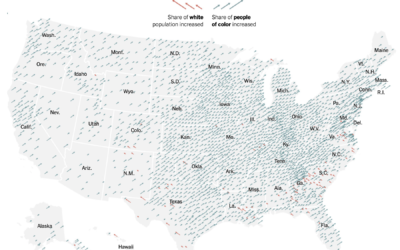
Shift in white population vs. people of color
The New York Times go with the angled arrows to show the shifts…
-
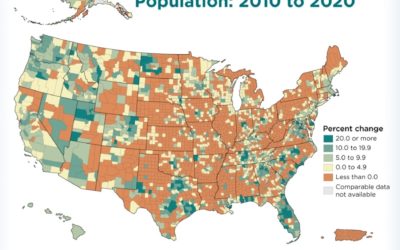
Maps of racial population change
Using their peaks and valleys metaphor, The Washington Post shows the shift in…
-
More detailed data release from Census 2020
After a lot of angst over the past few years around undercount, representation,…
-
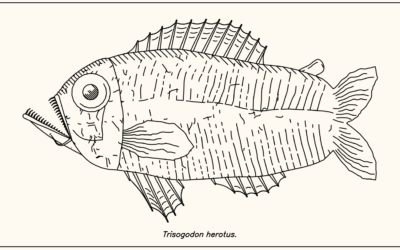
Procedurally generated fish drawings
Lingdong Huang’s project fishdraw seems straightforward on the surface. You go to the…
-
Members Only

Seeing Ranges – The Process 152
You’re gonna miss out on all the good stuff if you just stare at the middle.
-
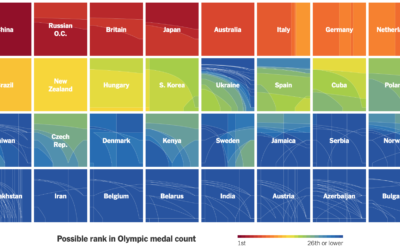
How countries ranked by Olympic medal counts
Ranking countries by medal count change depending on how much value you place…
-
Members Only
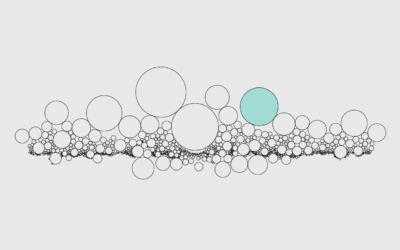
How to Use Packed Circles in R
Adjust coordinates, geometries, and encodings with packed circles to make various types of charts.
-
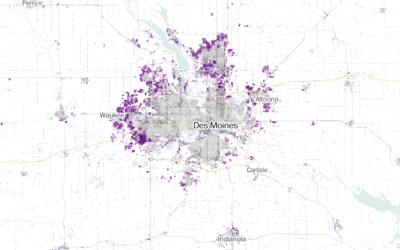
Where America is expanding in developed areas
Zach Levitt and Jess Eng for The Washington Post mapped newly developed areas…
-
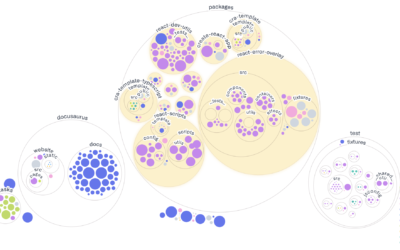
Visualizing GitHub repos
Most people are familiar with the file-and-folder view. Sort alphabetically, date, or file…
-
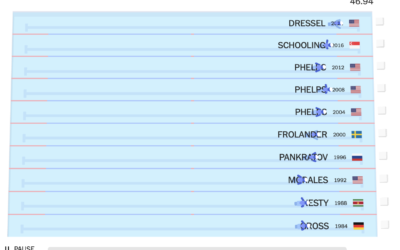
Olympic champions versus past Olympians
With the 2020 Olympics wrapped up, The New York Times raced this year’s…
-
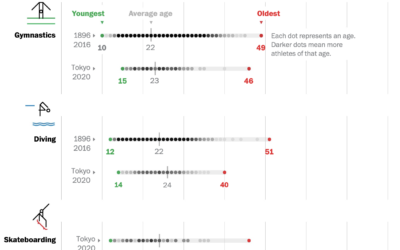
Age range of Olympians
Bonnie Berkowitz and Artur Galocha go with the strip plot to show the…
-

Testing the TikTok algorithm
[arve url=”https://www.youtube.com/watch?v=nfczi2cI6Cs” loop=”no” muted=”no” /]
The Wall Street Journal tested out the TikTok… -
Members Only
Foundational Visualization Skills – The Process 151
Set a strong base, and build whatever you want after that.
-
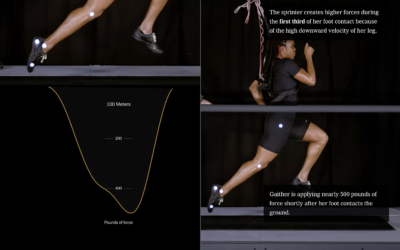
Science behind running fast vs. running far
From The New York Times, the combination of video, motion graphics, and charts,…
-
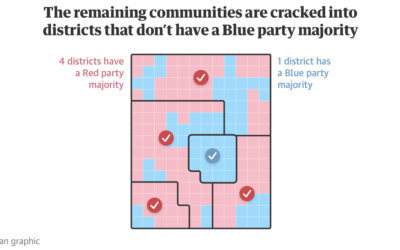
Visual guide to redistricting
Gerrymandering continues to be an important thread that I think many people still…
-
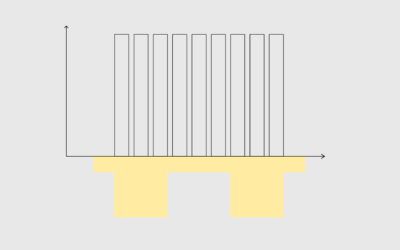
How We Spent Our Time in 2020 Versus 2019
Our everyday routines changed over the past year, and with the 2020 American Time Use Survey, we can see by how much.
Recently for Members
Browse by Chart Type See All →


Browse By Topic
Get the Book
 Visualize This: The FlowingData Guide to Design, Visualization, and Statistics
 Visualize This: The FlowingData Guide to Design, Visualization, and Statistics
Available now.