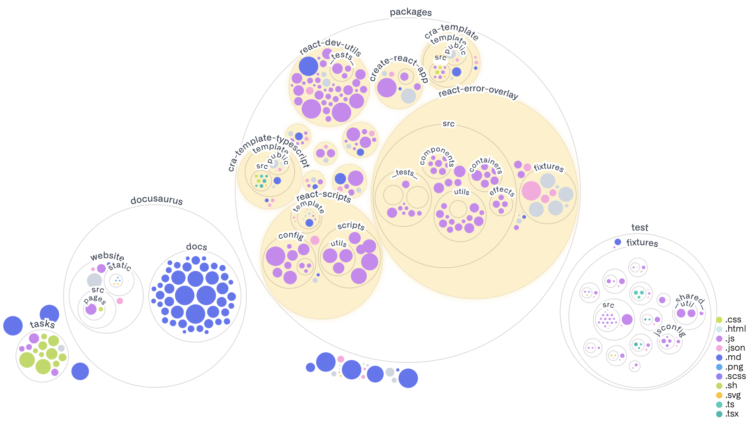
Most people are familiar with the file-and-folder view. Sort alphabetically, date, or file type, and scroll up and down. This works well when you know what you’re looking for, but sometimes you could use a quick overview of what a codebase looks like. Amelia Wattenberger for GitHub used packed circles.
The fun part is towards the end where you can enter any repo to see what it looks like.

 Visualize This: The FlowingData Guide to Design, Visualization, and Statistics (2nd Edition)