Triangulate, a fun tool made by Michael Freeman, lets you upload a picture…
2017
-
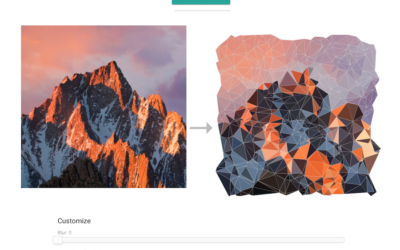
Triangulate a picture
-
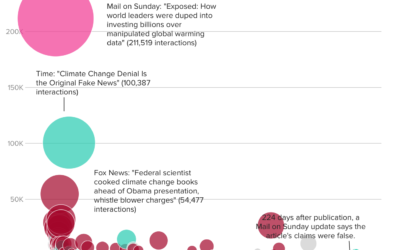
How fake data goes viral
BuzzFeed describes how an article on Daily Mail — that falsely reported claims…
-
Members Only
How I Made That: Interactive Beeswarm Chart to Compare Distributions
The histogram is my favorite chart type, but it’s unintuitive for many. So I’ve been using the less accurate but less abstract beeswarm.
-

Nine rounds a second sonified
The New York Times used sonification along with a dot plot to demonstrate…
-
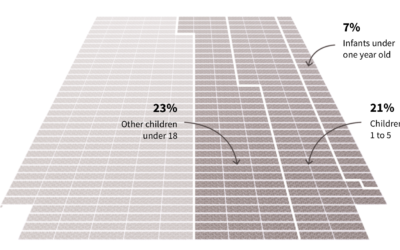
Mass exodus at human scale
Big numbers are too abstract in our minds to fully understand the scale…
-
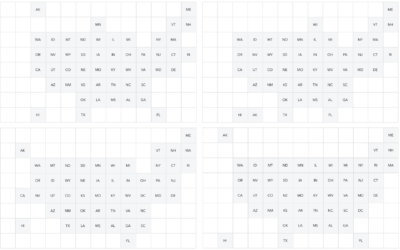
Grid map variations
Grid maps are a useful way to show state-level data, as they give…
-

Falling is Learning
I’ve been teaching my three-year-old son how to ride his bike on two…
-

Hand-drawn short trip
Have you seen this yet? Illustrator Alexander Perrin experimented with bringing a hand-drawn…
-
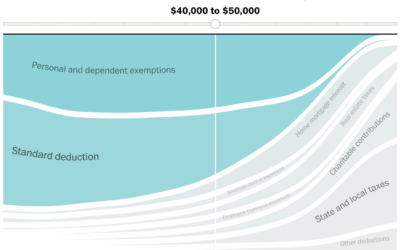
Given your income, most beneficial tax breaks
With the release of the Republican proposed tax plan, Reuben Fischer-Baum and Kevin…
-
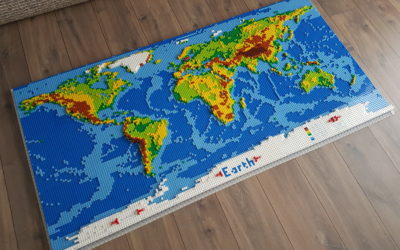
LEGO world map
Check out this five-foot long LEGO world map.
[W]e wanted to have a… -
Link
R or Python? →
Big community and lots of tools for both.
-
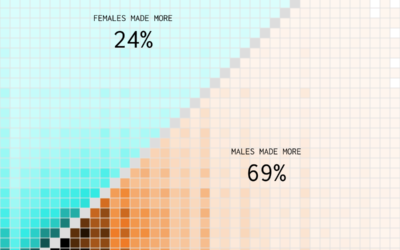
Who Earns More Income in American Households?
Compared to 1970, a shift towards women making the higher income.
-
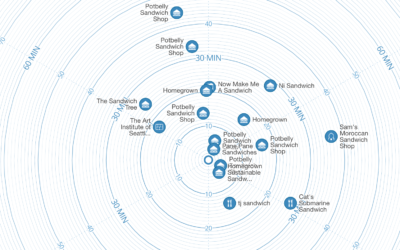
Time map shows locations based on how long it takes to get there
With the premise that we often search for locations based on how long…
-
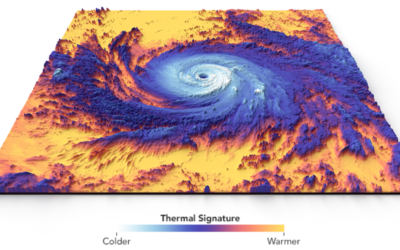
Thermal structure of Hurricane Maria
Hurricane Maria touched down in Puerto Rico. This visualization by Joshua Stevens at…
-
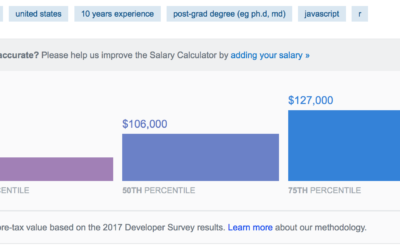
Stack Overflow salary calculator for developers
Stack Overflow used data from their developer survey to build a prediction model…
-
Looking for improbably frequent lottery winners
After hearing the story of reporter Lawrence Mower, who discovered fraudsters after a…
-
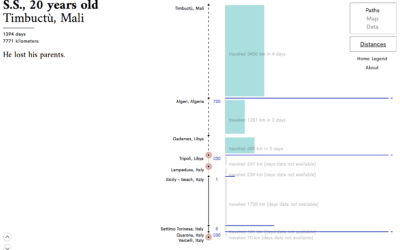
Visual narrative of six asylum seekers
We often visualize migration and people movement as lines that go from point…
-
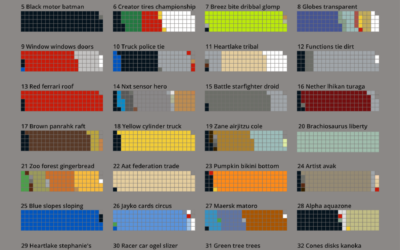
LEGO color scheme classifications
Nathanael Aff poked at LEGO brickset data with some text mining methods in…
-
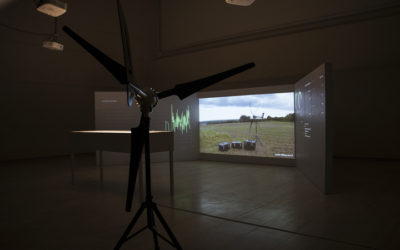
Computer uses wind to mine cryptocurrency and then fund climate research
HARVEST is an art piece by Julian Oliver that consists of a 4G-connected…
-
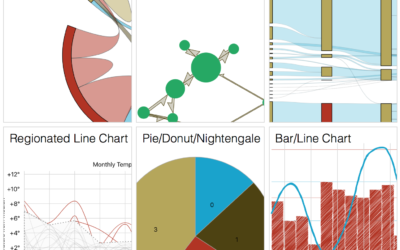
Semiotic, a visualization framework
Elijah Meeks released Semiotic into the wild. It’s a framework that allows quick…
Recently for Members
Second Edition
 Visualize This: The FlowingData Guide to Design, Visualization, and Statistics (2nd Edition)
 Visualize This: The FlowingData Guide to Design, Visualization, and Statistics (2nd Edition)
New tools, refined process.
Browse by Chart Type See All →


