Grid maps are a useful way to show state-level data, as they give equal visual weight to each state and maintain a bit of geographic location for quicker referencing. Each news organization varies the grid locations ever so slightly. Jane Pong collected a number of them to show the differences in this fun little interactive.
Grid map variations
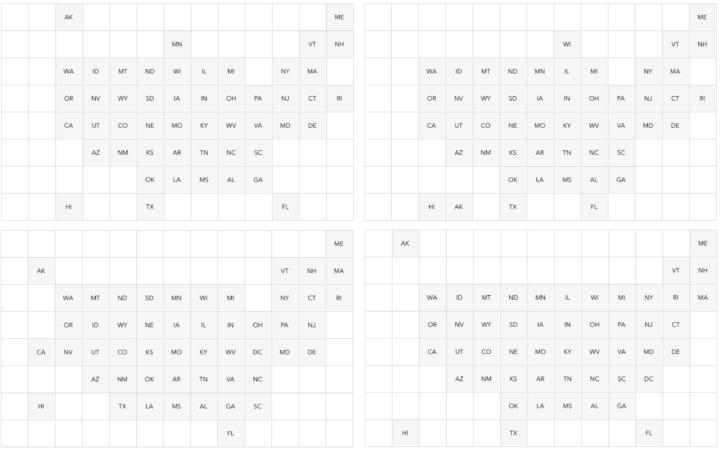
Chart Type Used

Second Edition
 Visualize This: The FlowingData Guide to Design, Visualization, and Statistics (2nd Edition)
 Visualize This: The FlowingData Guide to Design, Visualization, and Statistics (2nd Edition)
New tools, refined process.