President Obama will be answering questions live at a youth town hall today…
-

Conversation with Obama: track and ask questions on Twitter
-
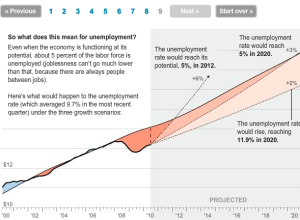
Explanation of current economic slump
Neil Irwin and Alicia Parlapiano of The Washington Post report with this interactive…
-
A different analytical wall
In reference to the wall between reporting data and understanding it, Martin Theus…
-
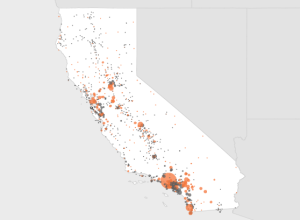
How K-12 schools in your area measure up
In collaboration with NBC News and The Gates Foundation, Ben Fry-headed Fathom Design…
-
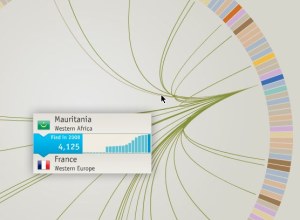
Where refugees come from
Thousands of people flee their country every year, and the travel patterns are…
-
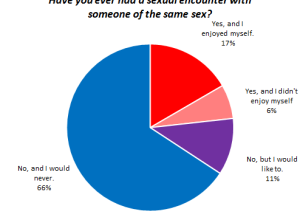
OkCupid explores gay and straight stereotypes
Online dating site OkCupid dives into their data for 3.2 million users again,…
-

Software evolution storylines
In a follow up to code_swarm, a visualization to show the development of…
-
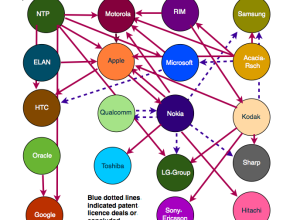
Mobile patent lawsuits
It seems like all the mobile groups are suing each other these days.…
-
The simple truth about statistics
Matt Parker explains why no one should be fooled by a misuse of…
-
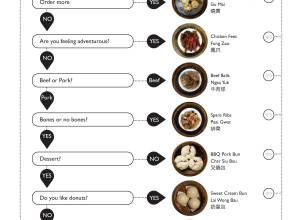
Eating guide for dim sum virgins
This guide on how to order dim sum is missing a lot food…
-
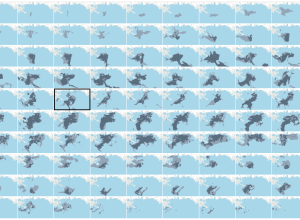
Map series of oil spill in Gulf
Everyone’s fascinated with animated graphics, which is cool, but sometimes a series of…
-
Gary Wolf on the quantified self
In his five-minute TED talk (below), Gary Wolf describes the quantified self and…
-
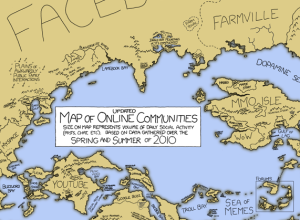
Fictional map of online communities
xkcd + numbers on online communities. Need I say more? Along the same…
-

Typographic maps
Cartography group Axis Maps continues their run of mapping goodness with the announcement…
-
Best of FlowingData – September 2010
Another month come and gone, and it was a good one. The FlowingData…
-

Make your vote count with VoteEasy
Do you know who you’ll be voting for this year? It can be…
-
FlowingData is brought to you by…
My many thanks to the FlowingData sponsors. I wouldn’t be able to do…
-
Q. How did your love of infographics begin?
Matthew asks:
You say that you blog for fun and out of love… -

Zombie survival guide
Since it’s October, all the zombie forces are preparing for attack. Luckily we…
-
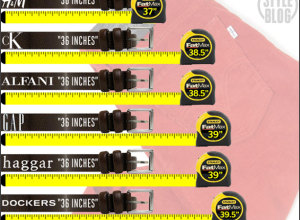
Challenge: Advertised vs. actual waistline
Ever notice how pants seem to fit differently from store-to-store even though they’re…
Recently for Members
Second Edition
 Visualize This: The FlowingData Guide to Design, Visualization, and Statistics (2nd Edition)
 Visualize This: The FlowingData Guide to Design, Visualization, and Statistics (2nd Edition)
New tools, refined process.
Browse by Chart Type See All →


