In a follow up to code_swarm, a visualization to show the development of software projects, Michael Ogawa has another look with Software Evolution Storylines:
My previous software visualization experiment, code_swarm, turned out pretty good. But some wanted a more analytic view of the data — one that was more persistent. I wondered about what this could look like, and came across this XKCD comic. It represents characters as lines that converge in time as they share scenes. Could this technique be adapted for software developers who work on the same code?
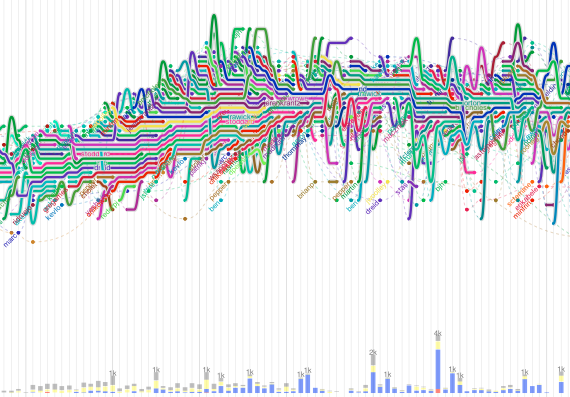
The difference between this and the xckd comic is that instead of fictional characters, there are now developers, and instead of characters crossing paths, developers cluster when they work commit changes to the same file. The histogram on the bottom provides information on the type of files that were committed during any given time. Roll over any line to focus on a specific devleoper.
The above is the Apache Webserver storylines.
Here are the storylines for Python. Development began with a few and then surged like a big ol’ bag of spaghetti.

[Storylines | Thanks, Michael]
 Visualize This: The FlowingData Guide to Design, Visualization, and Statistics (2nd Edition)
Pingback: Software evolution storylines | the 2k.now log
Beautiful visualization. Reminds me of my movie charts at http://xach.com/moviecharts/ a bit.
Tried github?
eg: http://github.com/rails/rails/network
Pingback: Seeing software evolve « A Great Becoming…