Friday was my last day at The Times, and this past Sunday, my last graphic ran in the paper. The story discussed Judge Michael Mukasey’s past rulings and experience. Who’s Michael Mukasey? He’s up for the spot of the new attorney general of course.
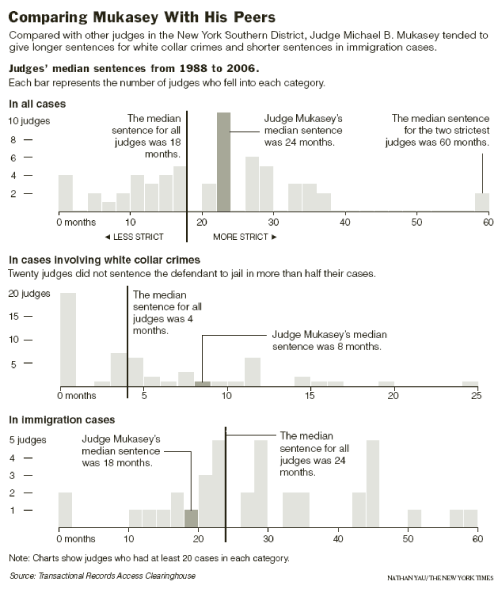
Anyways, I got to look through a lot of cool data on past rulings and busted out R for some statistical fun. This brought me to my last graphic. It compared Mukasey to his New York Southern District peers. You can see he’s been more strict overall but less strict in immigration cases. Unfortunately some spacing between each bar was lost in the web version; it looks much better in the actual paper.
That’s not the most exciting part though.
The Name Credit

When I opened up the early edition Saturday night, there it was — my name at the bottom of the graphic! What a great going away present.
 Visualize This: The FlowingData Guide to Design, Visualization, and Statistics (2nd Edition)
It’s kind of alarming to see so much sentencing variation between judges. What would you say was the median number of cases tried by judges?
Pretty interesting, eh? I don’t have the data with me, but I do remember seeing a lot of triple digits and high double digits for the cases in categories. For all cases, the numbers were in the hundreds and thousands (since the data is almost over 2 decades).
It’s probably also worth noting that only judges who had at least 20 cases in a given category are shown in the histogram while the overall medians include all judges for all the cases in the respective category.