Here’s a fun one from Philip Bump for The Washington Post. Bump simply…
Washington Post
-
Perfect seasons needed to get over .500 overall
-
Managing temperature fluctuations through UK architecture
Philip Kennicott, Simon Ducroquet, Frank Hulley-Jones and Aaron Steckelberg, for The Washington Post,…
-
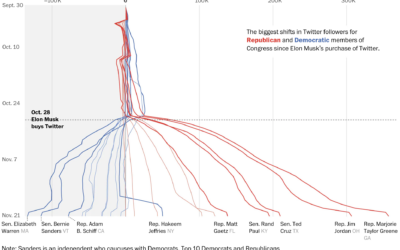
Republican and Democrat follower counts on Twitter
You might have heard that Elon Musk bought Twitter, and among the many…
-
8 billion population visualized
Here’s a fun interactive from The Washington Post to earmark the world reaching…
-
Daylight saving time and circadian rhythms
Daylight saving time ends in the United States this weekend and ended already…
-
What hearing loss sounds (and looks) like
Using an audiogram as a backdrop, Amanda Morris and Aaron Steckelberg, for The…
-
Election ad topics
Midterm election day is just about here in the U.S., so the political…
-
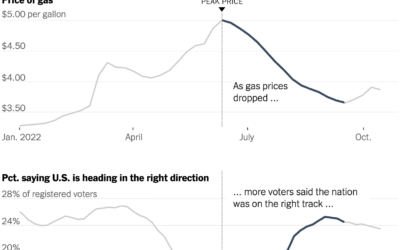
Gas prices and confidence
Everywhere you go, gas prices show up on big boards, like a proxy…
-
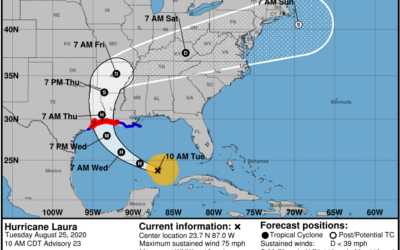
Difficulties reading the cone of uncertainty
It seems that there is always surprise when a hurricane makes landfall in…
-
Coffee versus tea in charts
Anahad O’Connor, Aaron Steckelberg and Garland Potts, for The Washington Post, made charts…
-
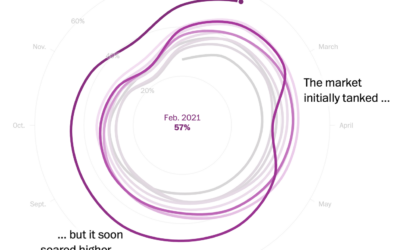
Housing market cooldown
I heard you like spiral charts when the data is seasonal. I think…
-
Border enforcement data collection
Drew Harwell, for The Washington Post, reporting on a growing database and who…
-
Gerrymandering detection with simulations
Harry Stevens, for The Washington Post, how simulations can be used to detect…
-
Losses and comebacks of Serena Williams
We tend to celebrate the wins in sports and often forget about or…
-
Welcome to Meltsville
It’s getting hot in cities around the world, each city with its own…
-
Indicators for a recession
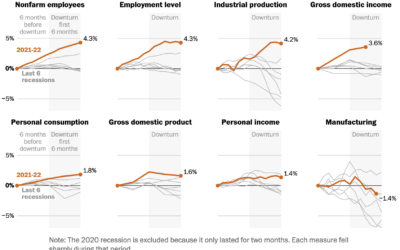
People disagree whether the United States is in a recession or not, because…
-
Odds of winning the big Mega Millions prize
With tonight’s Mega Millions jackpot estimated at $1.28 billion, you might be wondering…
-
A plea to stop climate change from the guy who makes maps
For Washington Post Opinion, a struggling mapmaker makes a plea to stop climate…
-
Melting popsicles to visualize a heat wave
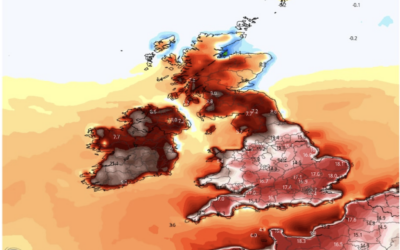
Many European countries are experience record high temperatures, so The Washington Post used…
-
Full scope of gun deaths in the U.S.
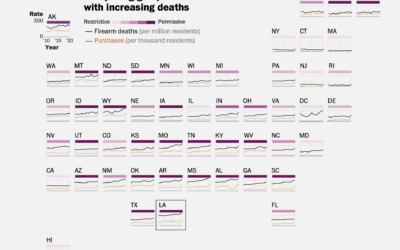
As I’m sure you know, mass shootings, which gain attention because the scale…













 Visualize This: The FlowingData Guide to Design, Visualization, and Statistics (2nd Edition)


