R has found its way into a good number of news groups who…
R
-
R in the data journalism workflow at FiveThirtyEight
-
Members Only
Annotating Charts in R
Let the data speak for itself they say. That doesn’t work a lot of the time, and when that happens, you need to explain.
-
5 Tips for Learning to Code for Visualization
Here are some tips to get you started, based on my own experiences with R, and more recently, the JavaScript library d3.js.
-
A Course for Visualizing Time Series Data in R
Learn to visualize temporal patterns in a couple of days.
-
Members Only
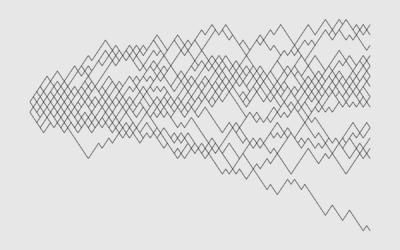
Drawing Lines and Segments in R
Show connections and changes over time with start and end points.
-
Members Only

Drawing Circles and Ellipses in R
Whether you use circles as visual encodings or as a way to highlight areas of a plot, there are functions at your disposal.
-
Members Only

Drawing Squares and Rectangles in R
R makes it easy to add squares and rectangles to your plots, but it gets a little tricky when you have a bunch to draw at once. The key is to break it down to the elements.
-
Members Only
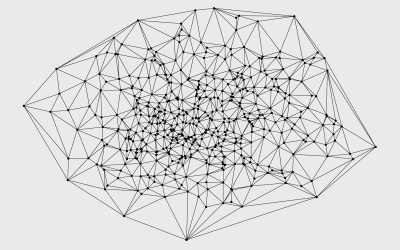
Voronoi Diagram and Delaunay Triangulation in R
The
deldirpackage by Rolf Turner makes the calculations and plotting straightforward, with a few lines of code. -
Comparing ggplot2 and R Base Graphics
Figure out which is best with a side-by-side comparison.
-
Members Only
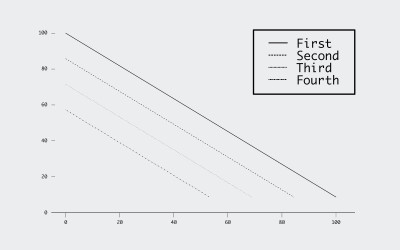
Adding Legends in R
Make sure you explain your visual encodings so that others can interpret them.
-
Emergency room data in R
For my graphic on emergency room visits over time and the other on…
-
Members Only
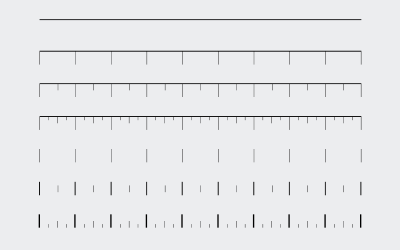
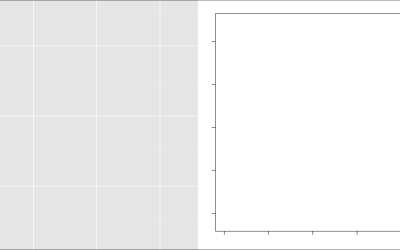
How to Customize Axes in R
For presentation purposes, it can be useful to adjust the style of your axes and reference lines for readability. It’s all about the details.
-
Link
Colors from images in R →
A how-to to break down images into just their colors.
-
Link
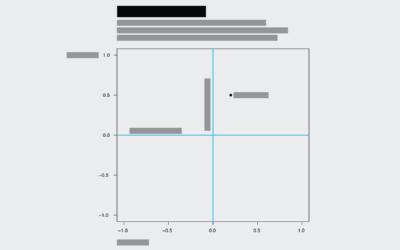
geomnet →
An R package for “Network visualization in the ‘ggplot2’ framework” by the folks at Iowa State.
-
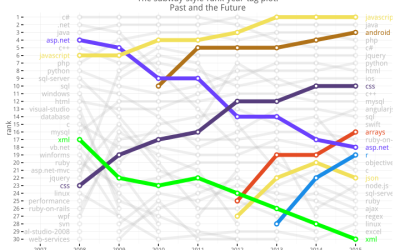
R growth on StackOverflow reigns supreme
Joshua Kunst did a quick analysis on tag usage on StackOverflow, the question…
-
Link
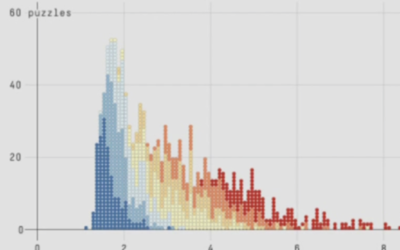
rchess →
An R package for chess move generation and validation.
-
Members Only
How to Make an Animated Pyramid Chart in R
Make a bunch of charts, string them together like a flip book, and there’s your animation. Sometimes good for showing changes over time. Always fun to play with.
-
Link
tigris →
A package to help you download and map TIGER shapefiles in R.
-
Members Only
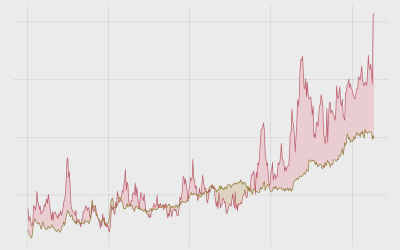
How to Make Bivariate Area Charts in R
Quickly compare two time series variables with this line-area chart hybrid that originated in the 1700s. Also known as: difference chart.
-
Link
R course material →
A small set of tutorials to learn the basics of R.
Recently for Members
Second Edition
 Visualize This: The FlowingData Guide to Design, Visualization, and Statistics (2nd Edition)
 Visualize This: The FlowingData Guide to Design, Visualization, and Statistics (2nd Edition)
New tools, refined process.
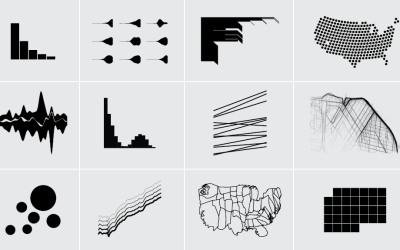
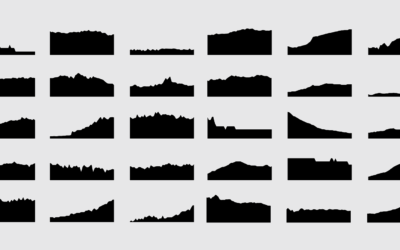
Browse by Chart Type See All →


