This Forbes post on the greatness that is R is being passed around…
R
-
R is the need-to-know stat software
-
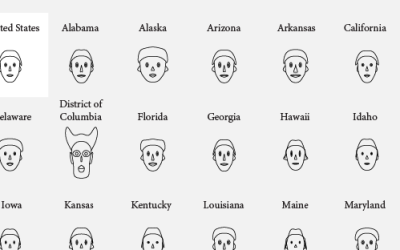
How to visualize data with cartoonish faces ala Chernoff
The goal of Chernoff faces is to show a bunch of variables at once via facial features like lips, eyes, and nose size. Most of the time there are better solutions, but the faces can be interesting to work with.
-
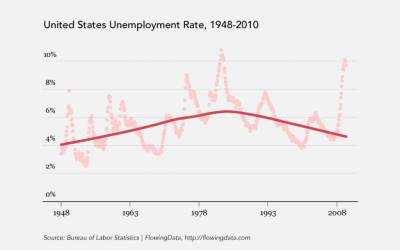
How to: make a scatterplot with a smooth fitted line
Oftentimes, you’ll want to fit a line to a bunch of data points. This tutorial will show you how to do that quickly and easily using open-source software, R.
-
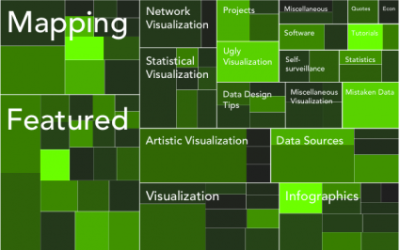
An Easy Way to Make a Treemap
If your data is a hierarchy, a treemap is a good way to show all the values at once and keep the structure in the visual. This is a quick way to make a treemap in R.
-
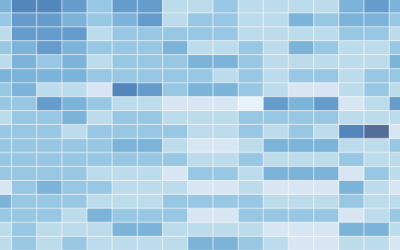
How to Make a Heatmap – a Quick and Easy Solution
A heatmap is a literal way of visualizing a table of numbers, where you substitute the numbers with colored cells. This is a quick way to make one in R.
Recently for Members
Second Edition
 Visualize This: The FlowingData Guide to Design, Visualization, and Statistics (2nd Edition)
 Visualize This: The FlowingData Guide to Design, Visualization, and Statistics (2nd Edition)
New tools, refined process.
Browse by Chart Type See All →


