• Membership
  • Newsletter
  • Projects
  • Learning
  • About
  • Member Login
  • Perceptron algorithm from the 1950s and its ties to LLMs

    February 25, 2025

    Topic

    Artificial Intelligence  /  ChatGPT, Frank Rosenblatt, perceptron, Welch Labs

    Welch Labs explains how the perceptron, an algorithm developed by Frank Rosenblatt in 1950s, is a foundation for current large language models that power chatbots like ChatGPT. You just have to link 100 million or so perceptrons in a single network.
    Read More

  • Estimating the ‘laziness’ of federal workers

    February 25, 2025

    Topic

    Statistical Visualization  /  effort, federal, Washington Post, work

    Some might have you believe that federal employees don’t put in the work. For the Washington Post’s Department of Data, Andrew Van Dam shows data that suggests otherwise.

    In case you’re unfamiliar with the WP column, Van Dam (usually) attempts to answer a question each week using data. I like how he takes the reader through the exploratory process of trying to figure things out. Most of the time, you can’t answer data questions directly, because there isn’t a direct metric for say, worker efforts. So you analyze the data that is available, build related insights, and see if that gets you to where you need to go.

  • Growing gender gap in ideology

    February 24, 2025

    Topic

    Statistical Visualization  /  Financial Times, gender, politics

    For Financial Times, John Burn-Murdoch shows the gap between men and women in political ideology with a set of difference charts (paywalled). It was typical for people in the same age cohort to follow similar politics, regardless of sex, because they lived similar experiences. But a split appears over the past decade with women leaning more liberal and men leaning more conservative.

    I wonder if this internet thing had anything to do with the change.

  • Shifts in German election

    February 24, 2025

    Topic

    Maps  /  election, Germany, New York Times

    German voters shifted away from the left in their general election this past Sunday. Christian Democrats (center right) won the most seats and Alternative for Germany (far right) came in second. The New York Times has maps and charts that show the change.

    Here in the U.S., I couldn’t tell you exactly how elections run elsewhere, so I appreciated the details NYT provides alongside the results.

  • Natural System of Colours, a recreation of 18th century color wheels

    February 24, 2025

    Topic

    Infographics  /  color, Moses Harris, Nicholas Rougeux, recreation

    In 1766, Moses Harris published The Natural System of Colours to demonstrate that one could create the full spectrum of colors by combining three primitives: red, yellow, and blue. As a design exercise, Nicholas Rougeux recreated the color wheels using digital tools. The full color palette as hexadecimals is available at the end.

    The Library of Congress has scans if you want to check out the original.

  • Government revenue and spending diagram

    February 21, 2025

    Topic

    Statistical Visualization  /  government, revenue, spending, USAFacts

    In case you’re wondering about government spending and budgets, USAFacts has a Sankey diagram that shows the money that came in during 2024 and how the revenue was distributed.

    According to data from U.S. Treasury Department, $4.9 trillion came in mostly through taxes and $6.8 trillion went out. The difference, $1.8 trillion, contributes to the deficit. It will be interesting to see what this diagram looks like after this year is done (if the data exists).

  • Members Only

    Making of Defense Against Dishonest Charts

    February 20, 2025

    Topic

    The Process  /  behind the scenes, defense

    I published an interactive guide on reading charts, spotting the misleading ones, and visualizing data honestly. Here’s the process I used to get there.

  • Ubiquity of the Gorton font

    February 20, 2025

    Topic

    Design  /  Gorton, Marcin Wichary, typography

    Marcin Wichary dives deep into the Gorton font, calling it the hardest working font in Manhattan.

    The history of this strange font spans over a century and I’ve seen it in so many countries by now, used in so many situations. But it’s impossible for me to say Gorton is the most hard-working font in the world.

    To this title, there are many contenders. Garamond has a head start of 300+ years and has been released in more versions than letters in any alphabet. Helvetica is so famous and used so much that even its ugly copy, Arial, became a household name. Whatever font MS Office or a popular operating system appoint to be “the default” – from Times New Roman through Calibri to Roboto – immediately enjoys the world premiere that any Hollywood movie would be envious of. There is even a 5×7 pixel font originally started by Hitachi that you can see everywhere on cheap electronic displays in cash registers and intercoms.

    But there is one place in the world where Gorton pulls triple duty, and I feel confident in saying at least this: Gorton is the hardest working font in Manhattan.

    There are many pictures and diagrams, but my favorite part are the interactive bits that let you type letters to see and compare characters.

  • Gulf of wherever you want

    February 19, 2025

    Topic

    Maps  /  Gulf of Mexico, MapQuest

    Most of the major map providers changed the name. MapQuest had a different idea. Enter whatever you want and download. (Their standard map still reads the Gulf of Mexico.)

  • How tariffs work

    February 19, 2025

    Topic

    Statistical Visualization  /  New York Times, tariff

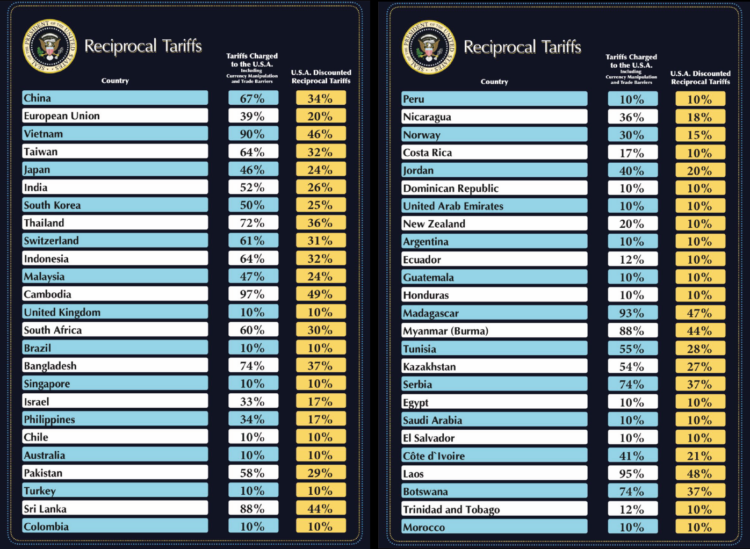
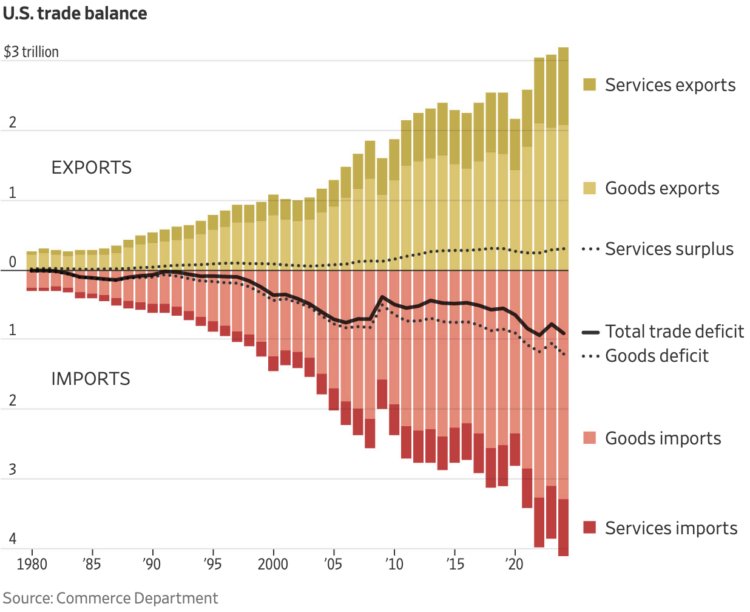
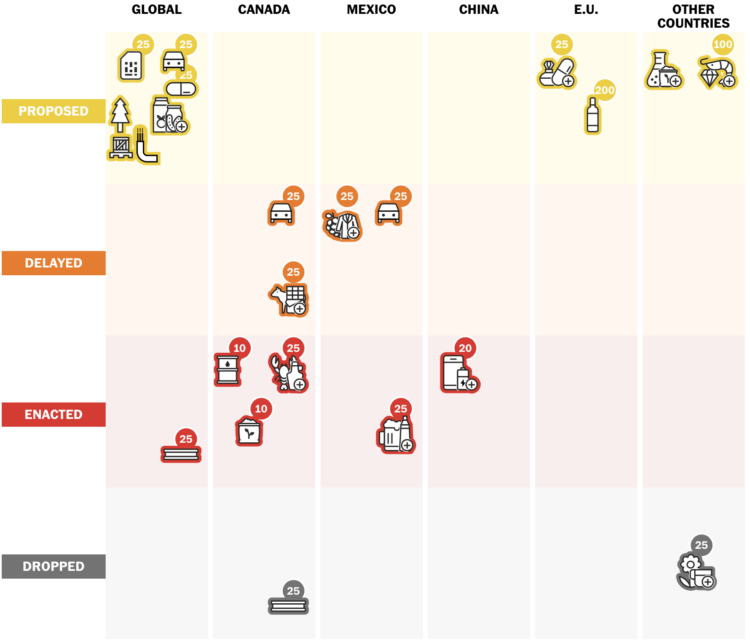
    I think I’ve read about tariffs more in the past month than I have my entire life. They’ve been pitched as a cure-all to make countries give into U.S. demands. As you might expect, the effects are not so straightforward or predictable. For The New York Times, June Kim describes various scenarios with a shoe example, as most shoes bought in the U.S. are made elsewhere.

  • $8 billion was actually $8 million in DOGE mistake

    February 19, 2025

    Topic

    Mistaken Data  /  DOGE, funding, government, Upshot

    The DOGE site has a “wall of receipts” that claims $55 billion in federal government savings. However, as noted by NYT’s the Upshot, a large line item, since removed, showed a contract for $8 billion (with a ‘b’) that should’ve been $8 million (with an ‘m’):

    Almost half of those line-item savings could be attributed to a single $8 billion contract for the Immigration and Customs Enforcement agency. But it appears that the DOGE list vastly overstated the actual intended value of that contract. A closer scrutiny of a federal database shows that a recent version of the contract was for $8 million, not $8 billion. A larger total savings number published on the site, $55 billion, lacked specific documentation.

    Everyone makes mistakes, but it seems out of bounds when coupled with firings, takedowns, budget cuts, and all the other stuff.

  • Heatmaps and Defining Color Scales

    With color as the visual encoding, choose the scales that allow you to see actual patterns.

  • Charting data that might disappear soon

    February 18, 2025

    Topic

    Statistical Visualization  /  government, takedown, Washington Post

    The administration continues its takedown of data that it doesn’t agree with. To get ahead of the wave, if by just a little, Andrew Van Dam for Washington Post’s Department of Data charted datasets that might disappear soon.

  • 150-year-olds probably not receiving Social Security benefits

    February 18, 2025

    Topic

    Mistaken Data  /  government, Social Security Administration, spending, Wired

    The Department of Government Efficiency claims data in the Social Security Administration database shows 150-year-olds receiving benefits. Probably not. For Wired, David Gilbert reports:

    Because COBOL does not have a date type, some implementations rely instead on a system whereby all dates are coded to a reference point. The most commonly used is May 20, 1875, as this was the date of an international standards-setting conference held in Paris, known as the “Convention du Mètre.”

    These systems default to the reference point when a birth date is missing or incomplete, meaning all of those entries in 2025 would show an age of 150.

    That’s just one possible explanation for what DOGE allegedly found. Musk could also have simply looked up the SSA’s own website, which explains that since September 2015 the agency has automatically stopped benefit payments when anyone reaches the age of 115.

    Is it feigned ignorance? It’s hard to believe that someone with Musk’s status would take data at face value.

  • A life documented in weeks

    February 17, 2025

    Topic

    Self-surveillance  /  Gina Trapani, journal, life, weeks

    Coming up on 50 years old, Gina Trapani mapped out her life so far in one-week segments. Colors indicate decades and significant moments in time get text. The timeline is at 49 years old and goes up to 100.

    This is great. It’s a way to remember and a way to look forward.

  • Open letter from former Census Bureau director

    February 17, 2025

    Topic

    Statistics  /  Census Bureau, government, Robert Santos

    Robert Santos, who resigned last month, wrote a heartfelt open letter to Census Bureau workers:

    Now, a transition of administrations has occurred as part of our republic’s democratic process. Uncertainty and stress abound. Events are unfolding rapidly. Families are suffering. As a nascent former director, please know that I feel your pain. And in all honestly, stormy weather lies ahead. Yet, the Census Bureau’s mission remains as a beacon of hope.

    During my service, I saw that the Bureau’s career staff benefit from four sources of strength. First is your intense dedication to mission. You are leaders in providing quality statistical data about our nation’s people and economy and do this exceptionally well. Each staff person makes their unique contribution towards the mission. Our country needs that more than ever. Second are the Bureau’s organizational values of scientific integrity, objectivity, transparency and independence. These are powerful tools to guide decision making. Third is your profound resilience. You demonstrated to the world that a quality decennial census could be conducted in the midst of a deadly global pandemic. That resilience remains with you, and you’ll again need to draw upon it. Lastly, you have each other. The bonds of colleagueship run deep at the Bureau and are a great source of strength. Beyond these, please understand that there are many, many communities of external stakeholders (me included) who actively advocate for you and the federal statistical community. Stakeholders represent a robust source of strength, and I pray they provide a measure of comfort in these challenging times.

  • DOGE wants access to IRS taxpayer data

    February 16, 2025

    Topic

    Data Sharing  /  DOGE, government, IRS

    For the Washington Post, Jacob Bogage and Jeff Stein report:

    Under pressure from the White House, the IRS is considering a memorandum of understanding that would give officials from DOGE — which stands for Department of Government Efficiency — broad access to tax-agency systems, property and datasets. Among them is the Integrated Data Retrieval System, or IDRS, which enables tax agency employees to access IRS accounts — including personal identification numbers — and bank information. It also lets them enter and adjust transaction data and automatically generate notices, collection documents and other records.

  • Rise and fall and rise again for bitcoin

    February 14, 2025

    Topic

    Statistical Visualization  /  Bitcoin, cryptocurrency, Financial Times

    There was a moment a few years ago when cryptocurrency was mentioned everywhere you went. Then it faded for a while. But now it’s kind of back. With the new administration, Financial Times (paywalled) charted bitcoin’s fluctuations. They used a scrolly format that shows a fixed window of time as you go. I like the small thumbnail that keeps you oriented in the timeline.

  • Possible field of vision from the helicopter seat

    February 14, 2025

    Topic

    Infographics  /  crash, helicopter, New York Times, point of view

    From the outsider point of view, a path towards collision might seem obvious, but things look different from a pilot’s point of view at night. The New York Times built a 3-D model to visualize what the Black Hawk pilots might have seen before the crash with a commercial plane.

    The Times analysis also indicates that the pilots’ view of the ground and river below would not have drastically changed to offer a visual cue that their helicopter had temporarily drifted into an unsafe path, above the authorized altitude in this area. Whether the Black Hawk’s instruments gave the pilots any indication that they were flying higher than authorized is unclear.

    The maps and animation, just short of a flight simulator game, illustrate why the reasons for the crash aren’t so obvious.

  • Members Only

    Designs for Missing/Changing Data

    February 13, 2025

    Topic

    The Process  /  estimation, missing data

    How do we visualize the data that isn’t there or new estimates that arise when methodology changes?

  • Page 8 of 392
  • <
  • 1
  • ...
  • 5
  • 6
  • 7
  • 8
  • 9
  • 10
  • ...
  • 392
  • >

Analyze, visualize, and communicate data usefully, beyond the defaults.

Become a member →

Recently for Members

May 15, 2025
Step Chart, Enhanced

May 8, 2025
When the data is not what it seems

May 1, 2025
Finding the Right Charts

April 24, 2025
Visualization Tools, Datasets, and Resources – April 2025 Roundup

April 17, 2025
Breaking Out of Chart Software Defaults

Get the Book

Visualize This: The FlowingData Guide to Design, Visualization, and Statistics

Available now.

Order: Amazon / Bookshop

Browse by Chart Type See All →

Baseline Chart Stacked Bar Chart Spiral Chart Horizon Graph Radar Chart Histogram Strip Plot Network Graph Density Plot Box Plot

Browse By Topic

  • Visualization

    Seeing data

  • Maps

    Seeing geographic data

  • Infographics

    Explaining data

  • Networks

    Connecting data

  • Statistics

    Analyzing data

  • Software

    Working with data

  • Sources

    Getting data

  • Design

    Making data readable

Made by FlowingData

  • The Process

  • Data Underload

  • Chart Everything

  • Guides

  • Books

  • Shop

  • About
  • Contact
  • Newsletter
  • LinkedIn
  • Instagram
  • Bluesky
  • RSS
Copyright © 2007-Present FlowingData. All rights reserved.