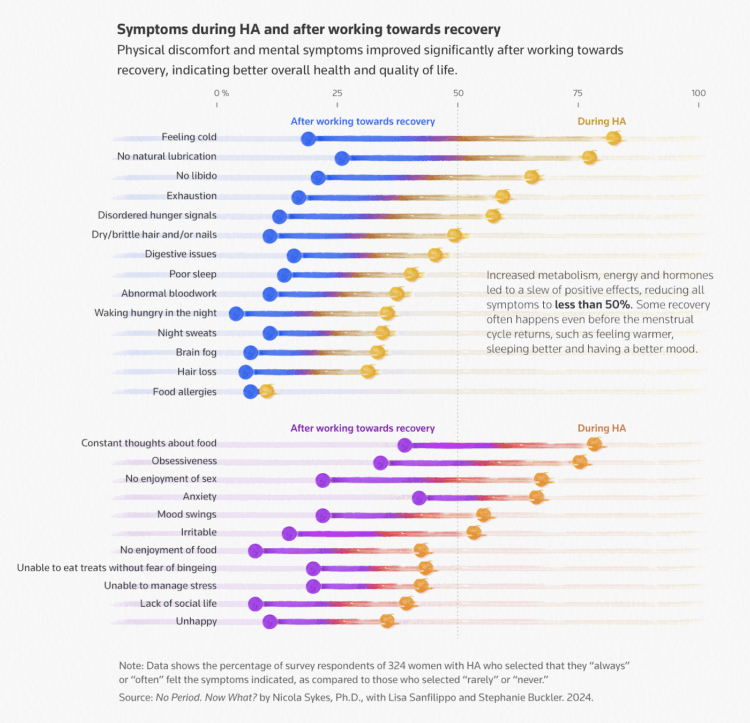
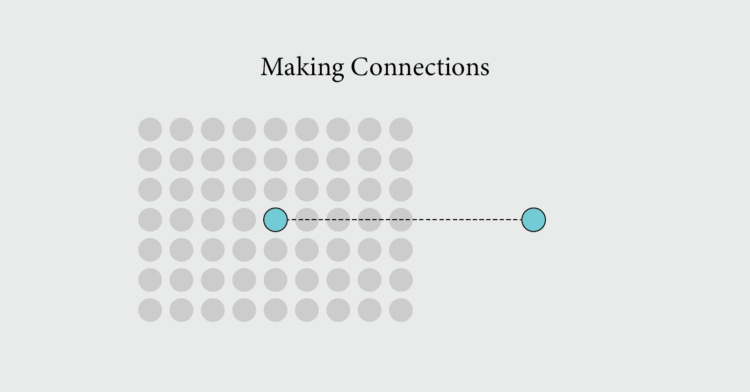
• For The Verge, Justine Calma reports on the recent takedowns. Some groups have been preparing for this:

    The End of Term Web Archive project has saved content on federal government websites during every presidential transition since 2008. The Environmental Data and Governance Initiative (EDGI) that formed after Trump was first elected also documents changes to government websites and works to make archived datasets available elsewhere. It has backed up data from the CDC’s Social Vulnerability Index and Environmental Justice Index and shared it on a webpage for The Public Environmental Data Project.

    Yet even if these datasets have been archived, they aren’t as helpful when they aren’t updated. “Any dataset has a lifespan of utility,” says Dan Pisut, senior principal engineer at GIS software company Esri.

    Of course, this is just the beginning. Remember: marathon, not sprint.

  • The New York Times used a programmatic approach to estimate the number of pages taken down so far since Friday. Ethan Singer reporting:

    On Friday, The Times downloaded the list of the most visited government domains in the U.S. and began compiling the complete list of pages available on each one using each site’s sitemap, a file that outlines the structure of a website and is typically used by search engines to keep track of what’s on the internet. (Some sites, including state.gov and weather.gov, were not included in our analysis because we were unable to identify a complete list of web pages on their sites, or for other technical reasons.) In all, we were able to identify more than seven million pages across more than 150 sites.

    We then repeated this process several times Friday night and on Saturday, and compared our new list of websites with those we originally found.

    About 3,000 pages from the Centers for Disease Control and Prevention, 3,000 from the Census Bureau, and 1,000 from the Office of Justice Programs make up the bulk of takedown.

  • In preparation for days like this, MIT Libraries has a guide for making usable backups:

    The United States (US) federal government collects, aggregates, and disseminates a large volume of information and data. This content is used by researchers, policymakers, and many others for various purposes.

    Protecting access to US federal government data between and during presidential administrations is important. Data can potentially disappear because of government shutdowns, broken links, and policy shifts.

    This checklist provides steps you can take to ensure the government data you use in your research remains accessible to you and others.

    Identify the data, confirm, backup with documentation, and maintain re-usability.

  • Groups at universities and research labs are forming to preserve data. Naseem Miller reports:

    The ad hoc group that organized Friday’s data marathon at Chan School calls itself “The Preserving Public Health Data Collective” and it’s part of a growing effort among researchers and academic institutions across the U.S. to save federal health websites and databases.

    Researchers are using different tools, including downloading datasets, scraping websites and archiving them with the Wayback Machine, which is an initiative of the Internet Archive, a nonprofit digital library of Internet sites. It enables users to see how websites looked in the past.

    The changes to government websites are happening faster than researchers can keep up with.

    There are some tips on how you can preserve websites, including saving them to the Wayback Machine and suggesting databases to The Data Liberation Project.

  • As of this evening on January 31, 2025, the data portal for the Centers for Disease Control and Prevention is offline. You get the following text:

    Data.CDC.gov is temporarily offline in order to comply with Executive Order 14168 Defending Women From Gender Ideology Extremism and Restoring Biological Truth to the Federal Government and the OPM notice dated January 29, 2025, “Initial Guidance Regarding President Trump’s Executive Order Defending Women from Gender Ideology Extremism and Restoring Biological Truth to the Federal Government (Defending Women).” The website will resume operations once in compliance.

    The takedown is part of a directive to halt research and cut funding. From Roni Rabin and Apoorva Mandavilli for The New York Times:

    On Friday, hundreds of scientists gathered for a “datathon,” in an attempt to preserve websites related to health equity.

    “There’s been a history in this country recently of trying to make data disappear, as if that makes problems disappear,” said Nancy Krieger, a social epidemiologist at Harvard University and a co-leader of the effort.

  • As of Friday, January 31, 2025 at 3:26pm PST, the U.S. Census Bureau homepage is blank.

    I did not see that coming.

    FAA.gov also appears to be down. Any others?

    Update, 1/31/2025 6:50pm PST The Census.gov address is loading again, but the index.html link still points to the blank page with the input field. The FAA site only works with www is back online offline again.

  • The Washington Post mapped the flight paths leading up to the collision over the Potomac River.

    The helicopter and the American Eagle plane were in “standard” flight patterns, Transportation Secretary Sean P. Duffy said at a morning news conference. The patterns, Duffy said, were not unusual for D.C. airspace. “Something went wrong here,” he said.

    That “something” is still unknown. Flight data is going to get a close examination over the next few weeks. I hope the data is accurate.

  • The Census Bureau director Robert Santos announced his resignation on Thursday:

    Santos — a nationally recognized statistician who is the first Latino to head the bureau — joined the federal government’s largest statistical agency as a Biden appointee after years of interference at the bureau by the first Trump administration.

    Before becoming the agency’s director, Santos was a vocal opponent of how Trump officials handled the 2020 census — including a last-minute decision to end counting early during the COVID-19 pandemic and a failed push to add a question about U.S. citizenship status that was likely to deter many Latino and Asian American residents from participating in the official population tally.

    This is not totally unexpected, given there were resignations in 2017 and 2021, but still. You can see how data can be influenced and why we need to think about data carefully.

  • With the art installation tele-present wind, David Bowen displays data collected by NASA’s Perseverance rover mission. Grass stalks are attached to mechanical devices that shift the stalks back and forth in unison. The abstract Martian data becomes tangible and a physical space you can walk through.
    Read More

  • Members Only

    Here are things you can use, poke at, and learn from that bubbled up this past month.

  • Maggie Appleton is growing a human, and as you might expect, pregnancy can be tiring. The data from her watch says so:

    I felt slightly validated when this subjective feeling-like-shit state clearly showed up in my Garmin tracking data. From the moment I found out I was pregnant in mid-July, my resting heart rate began to rise, my stress graph went permanently orange, and my sleep quality dropped.

  • Noah Kalina has been taking a picture of himself every day for 25 years. He earmarked the milestone with a look through his archives. That is a lot of selfies.

    For the uninitiated, Kalina gained mainstream attention in 2007 after taking a picture of himself every day for six years. The Simpsons even riffed on the project with a version with Homer Simpson. My favorite remix was the time-lapse of a research paper.

  • A spreadsheet of 2,600 grant and loan programs circulated to federal agencies, alongside a memo to freeze spending. NYT’s Upshot listed and linked to all of them.

  • NBA all-star voting is mostly for the fans, which means some players can get a lot of votes because they’re fan favorites and less so because they’re having a great season. Owen Phillips plotted votes against estimated plus-minus, which is a metric that estimates players’ contributions in points when they’re on the floor, to see who is overrated and underrated.

    The trend is actually tighter than I expected. Bronny James appears to be the standout in the bunch, maybe not for the preferred reasons though.

  • New to me, Plain Text Sports shows box scores for the major sports and leagues. It’s exactly what the title suggests. Instead of going to the ad- and cookie-dominated sports sites that take forever to load, you can go here and get game updates in a simple, plain-text view.

    It takes me back to my BBSing days, when my parents just absolutely loved that I tied up the phone line during all available hours.
     

  • Cozy games are casual games that give you a warm, fuzzy feeling when you play them. Design a character, walk around, and chat with others. To demonstrate the mechanics and provide background, Reuters designed a cozy game within an explainer.

    You are a radish of some sort in a fictional town of Rootersville. Tend to your garden, clean your house, and talk to the other root vegetables. There are sound effects and background music. You earn badges along the way.

    I understand cozy games now.

  • Using satellite data, researchers analyzed the growth rate of 60,000 fires in the contiguous United States, between 2001 and 2020. Fires are growing faster and getting bigger. Reuters mapped the most destructive ones compared against the recent fires in Los Angeles.

    The bright fire illustrations against the smokey background work well to highlight the destruction.

  • How many people in the United States have a high school education or less, earn more than $200,000 in salary, work 20 to 29 hours per week, and have a commute under 15 minutes? A couple thousand do, based on estimates from the most recent 2023 American Community Survey. Sign me up.

    Better yet, let’s join the few thousand with no commute, working less than a quarter time, and earning more than $200,000. That sounds pretty good.

    How many people are in your work cohort?

  • In Kindergarten Cop, one of Arnold Schwarzenegger’s greatest works, a mother welcomes the title character: “Welcome to Astoria, the single-parent capital of America.” For the Washington Post’s Department of Data, Andrew Van Dam investigates if that is really true:

    Astoria, the United States’ first settlement west of the Rockies, doesn’t fit the bill. While the city may not have parlayed its position at the mouth of the miles-wide Columbia River into success as the New Orleans or New York of the West Coast, as its boosters once dreamed, it has carved out a comfortable existence in Oregon’s northwestern extremity.

    There are Kindergarten Cop references and demographic data. If I were a moth, this is my flame.

  • Private schools cost extra. So as you might imagine, the demographics, often tied to income, tend to differ between private and public schools. ProPublica, by Sergio Hernández, Nat Lash, and Brandon Roberts, published a searchable database to see the differences for schools near you.

    Most of the data we use comes from the National Center for Education Statistics’ Private School Universe Survey, which has aimed to gather information about U.S. private schools every other year since 1989. Because the regulation of private schools is handled differently by state, there is no comprehensive list of every private school in the country. The PSS attempts to approximate such a list using various sources, including state education departments, private school associations and religious organizations, and, in some areas, online yellow pages and local government offices.