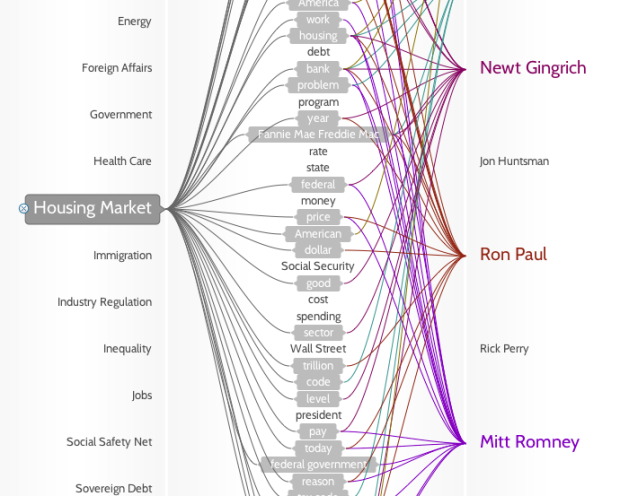
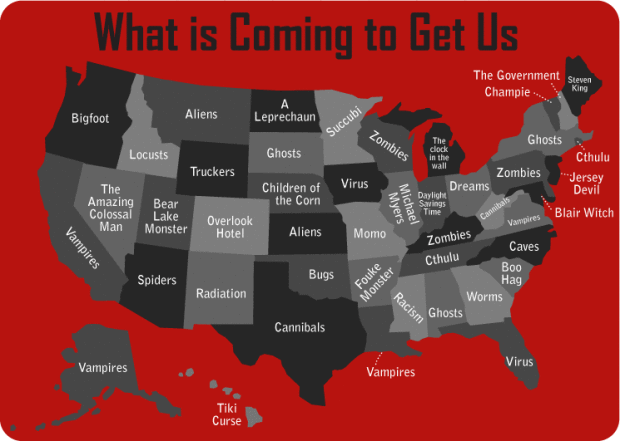
If you don’t watch the candidate debates — and let’s face it, that’s just about everyone — you pretty much miss everything, except for stuff like Rick Perry forgetting agency names. Politilines, by Periscopic, lets you see what the candidates talked about each night.
The left column lists top issues, the middle shows words used, and the right column shows candidates. Roll over any word or name to see who talked about what or what was talked about by whom.
The method:
We collected transcripts from the American Presidency Project at UCSB, categorized them by hand, then ranked lemmatized word-phrases (or n-grams) by their frequency of use. Word-phrases can be made of up to five words. Our ranking agorithm accounts for things such as exclusive word-phrases – meaning, it won’t count “United States” twice if it’s used in a higher n-gram such as “President of the United States.”
While still in beta, the mini-app is responsive and easy to use. The next challenge, I think, is to really show what everyone talked about. For example, click on education and you see Newt Gingrich, Ron Paul, and Rick Perry brought those up. Then roll over the names to see the words each candidate used related to that topic. You get some sense of content, but it’s still hard to decipher what each actually said about education.
 The
The 
 Note from Nathan: Last week, visualization researchers from all over gathered in Providence, Rhode Island for VisWeek 2011. One of the workshops, Telling Stories with Data, focused on data as narrative and what that means for visualization. This is a guest post by the organizers:
  Another month, another
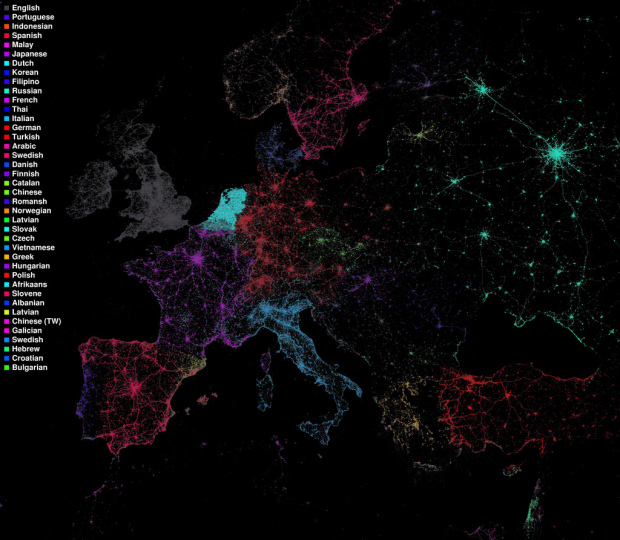
 Visualize This: The FlowingData Guide to Design, Visualization, and Statistics (2nd Edition)


